That is a great explanation, I really appreciate it. Thank you so much. I might take you up on a Skype conversation down the road, after I have learned a little more.
Hi,
I’d like to share with you changes I’ve made to the OliveOil notebook I originally created based on some of the feedback received.
I’ve made the following updates:
- Modified data source so that any of the 85 univariate UCD data sets can be used now
- Added 3 new time series encoders
- Modified the time series to image encoders so that images of different sizes can be created, independently of the time series length
- Up to 3 encoder can be simultaneously used. Each encoder creates a single channel image, and a 3 channel image is created by combining them.
- Incorporated the new data_block functionality
There are 7 image encoders available:
- ’Default’: raw time series
- ’Area’: time series area plot
- ’2D’: time series in 2D
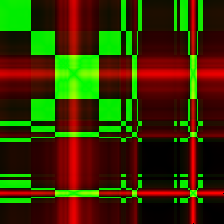
- RecurrencePlots: Recurrence Plot
- GASF: Gramian Angular Summation Field
- GADF: Gramian Angular Difference Field
- MTF: Markov Transition Field
I’ve run many tests with this updated notebook. If you are interested, you can read the key learnings in the Time series thread.
Based on the upgraded notebook, I’ve run some additional tests, and have some new insights on the OliveOil dataset:
- Area works better than Default and 2D as @marcmuc mentioned as one of his insights
- All image transformers work much better than any of the raw time series data. I think this is a significant finding, as there’s not much published on these transformers in relation to deep learning.
- In this test, RecurrentPlots was the single encoder that worked best. There’s a good explanation of this encoder by @mb4310 in this thread.
- The combination of transformers also improve the result. In my tests, best results were achieved when RecurrencePlots and MTF were used simultaneously.
- The size of the image also seems to be important. Resnet34 seems to work better when 224x224 pixel images are fed, and Resnet50 with 299x299 pixel images.
- Resnet50 does not necessarily work better than Resnet34. Actually in my tests, Resnet34 was slightly better.
- I have used progressive resizing but have not achieved any improvement.
Next steps:
- Start working with multivariate time series data
- Explore other time series to text encoders
In the near future I’d like to start implementing other classification/ regression state of the art techniques recently published. I think it’d bee good to work together to meet this goal. If anybody is interested in this, please, let me know.
10 Likes
I wonder if even smaller models and images would help? Maybe 112x112? Maybe resnet18?
Many thanks for this great work. FYI I had some trouble figuring out from your notebook what your findings actually are. It would be great if you could create a little table of the actual numbers you got for the various different approaches for easy comparison, including raw ts, single transformations, and multiple transformations.
Interesting work. With tabular data it is common to add features that represent dates and times such as day of month, day of week, weekday, weekend, holiday, etc. It would be interesting to try and encode these features into the image. For example, you could break up your univariate series into N series where each N represents a feature that is plot on a stacked area plot. Something like this:

You could also try a variation using a 100% stacked chart like this:

Or you could encode each feature as a seperate channel in the image and ensure the pixels are normalized across all channels.
2 Likes
Thanks Jeremy!
I’ve performed some additional tests (including resnet 18 as you suggested) to have a more complete picture. Here’s the summary.
I’ve added added this to the notebook gist so that it’s clearer.
Sorry for the lengthy post!
Experiment:
I’ve run an experiment with 75 variations of encoders, image size and model architecture in the OliveOil dataset (UCR univariate dataset).
Note: the notebook is built in such a way that anyone can use any of the 85 available UCR univariate datasets.
Results:
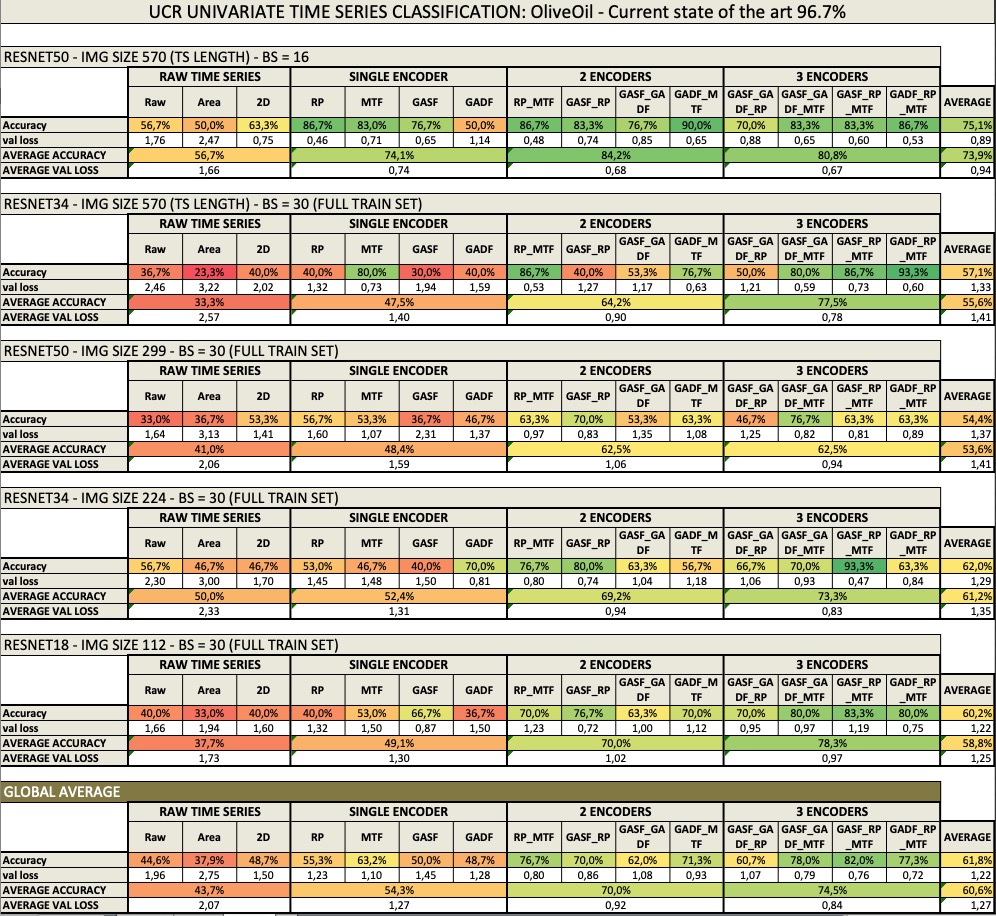
Key findings:
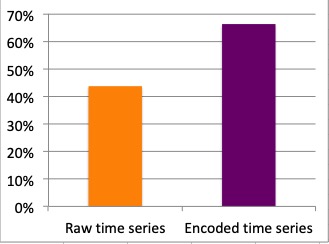
- Performance of images generated by encoders is higher than the raw image.
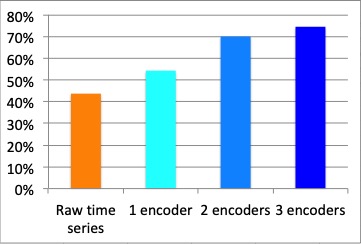
- Performance increases with the number of encoders used in the image (an encoder per image channel). Rich-content images perform better than simpler images.
- None of the raw time series techniques perform well.
- RecurrencePlots (RP) and Markov Transition Field (MTF) tend to perform better than Gramian Angular Field techniques (GASF/ GADF) in this dataset.
- The 3 main techniques seem to complement each other. Best absolute performance is achieved when one encoder from each type (RP, MTF, GAF) is used.
- Some of images generated by 3 encoders have a performance close to state of the art (actually in some of the runs, they reached state of the art. The numbers shown represent averages of 3 runs).
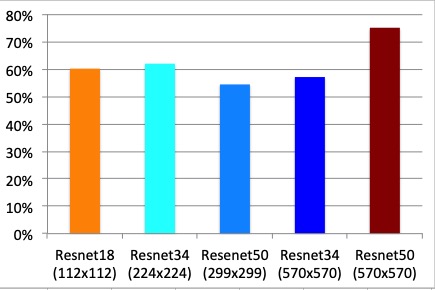
- Overall Resnet50 delivers the best result. However, that is only true when images are very large (570x570, which correspond to the time series length). This result is very consistent across all encoders.
- With smaller size images both Resnet18 and Resnet34 perform even better than Resnet50.
- Fastai general transfer learning can be successfully applied to images not present in the the initial training set (Imagenet).
Conclusion:
These results indicate that general transfer learning applied to time series encoded as images may be a useful classification technique.
Next steps:
- Apply these findings to other time series datasets.
- Modify the technique so that it can be applied to multivariate time series.
- Explore other state of the art multivariate time series techniques, and see how they can be implemented with fastai.
I’d like to thank all of those who have provided feedback/ ideas, in particular @mb4310, @marcmuc, @antorsae and Jeremy.
25 Likes
Fastai time series ‘learning competition’?
I was re-reading your post @mb4310 , and think I missed your proposal to select 1-2 datasets and work on them as a group trying out different techniques. Apologies for that.
I think that’d be great!
I’d suggest we might select an univariate dataset to test out simpler techniques, and a multivariate one for more complex/ intesting dataset/ tasks.
This approach could work as a fastai learning competition, where we could work individually or as a team to approach/ beat the state of the art, but with the goal of learning and share what we learn through notebooks.
We could also compare DL and non-DL as @henripal mentioned.
I’d suggest we could choose any of the UCR or UCI time series datasets where the state of the art is not 100% so that there is still room for improvement.
Please, let me know if you are interested so we can get this going.
In the meantime I’ll look for some some datasets we can use.
Look forward to getting your feedback!
1 Like
Hi @marcmuc,
I’ve found a very interesting dataset repository (UCI machine learning repository) that contains 452 data sets, out of which 86 are time series dataset.
Some of them are energy related, and some of them regression.
I was thinking that you might select one of these multivariate datasets, and we can work on it as a team based on @mb4310 ’s proposal. What do you think?
5 Likes
Thanks for pointing that out, I had found one of those datasets independently this weekend and downloaded it (the ElectricityLoadDiagrams dataset), but the problem for my usecase mentioned above is that the data is unlabeled. Same with the household data. But combining both datasets would at least give me two classes (household vs. industry , as the ELD one first sight all seem large consumers…). I will continue to investigate this. But choosing something and working on it together (or as a little internal competition) sounds like a very nice plan! And I am happy to work on non-energy data too, that was just what I tried first due to my background in that area…
Hi @mb4310, thanks a lot for sharing both notebooks!
I’ve eventually been able to see the work you’ve done on both, and I think it’s great.
ULMFiT: After reading your ULMFiT notebook I think I now understand the approach better.
I have a question though. To train the forecsater, if I understand it correctly, you pick subsequences of each train time series that do not overlap. I guess you get about 3 subsequences from each training sample, so you train the model in about 3000 samples. And you say maybe the training set if small. But why don’t you train it on sequences that overlap? I mean, why don’t you randomly select subsequences of length bptt if the goal is just to train a model to predict the next step? That would give you an almost unlimited training samples (around 700k I think).
CNN: I like your approach you’ve taken, certainly much cleaner and professional than what I’d done!!  Big thanks!!
Since I send the first version of the notebook out, I have made changes to it based on some learnings, so I’ll try to kind of merge both notebooks to ensure they are easy to use. I’ve already included the possibility of combining up to 3 encoders in the same image, for example, and it works better than just one encoder. You can find the most recent version here (have not incorporated any of your ideas yet, but will do)
First fastai time series learning competition:
I believe we can all learn more if we focus ourselves on the same time problems, and work together to resolve it.
For that reason, I’d like to propose that we run some time series ‘learning competitions’ (univariate and multivariate).
Basic rules:
- The goal of the competition is to learn as much as possible and share that knowledge with the rest. Performance will obviously help us gauge the value of different proposed approaches. But we can also learn from those techniques that didn’t work.
- We will openly share ideas, feedback with the rest, and will upload our notebooks to the shared ts repository. No performance improvement will be valid if the notebook is not shared.
- Timeline: I’d say end of the course, although we can extend it if you are interested.
- We can create a new thread for each learning competition. There won’t be any formal submission process, just mention it in the specific thread, and load the notebook.
- Award: learning, feeling of contribution, ::,
 …
…
Note: personally I plan to attend part 2, so I’ll be around longer.
As a first competition I’d propose a univariate time series:
Earthquakes (UCR time series dataset)
This is a binary classification task, where the key metric is accuracy.
Based on the UCR web page the current SOTA is 75.92%. Will we be able to beat that?
Please, let me know if you ok with this proposal? Do you plan to participate?
Would you like to propose another (multivariate) dataset?
If so, please, let me know and I’ll go ahead and create a thread to address this.
Thanks
6 Likes
Hi, I’m very interested in such a series of competitions.
For the future, I’d like to mention another potential source for datasets: a relatively high profile competition for forecasting is organized every year. The last one, M4 was run on a dataset of 100,000 different time series, at different intervals and of different natures. You can read more about the dataset here.
@tukun previously mentioned the results of this competition and the fact that although the leaderboard was dominated by pure statistical methods, the winner was using a hybrid ES-RNN method.
6 Likes
Hi @oguiza,
I will participate! I appreciate your comments! The choice to take 3 subsequences is just to be efficient with preprocessing, Jeremy explains this well in a video of part1 of v2 of his course on NLP. Because the RNN doesn’t just take timesteps 1 to N-1 and output the value at step N, it outputs a sequence of length N-1 (which it’s aiming for to predict timesteps 2 to N); and the RMSE is computed all N-1 of those values. The reason the timeseries is chosen to be cut in 3 pieces (say) is because if we fed the whole timeseries in at once it can be memory intensive to back propagate errors through very many time steps (and if we decide that information from very long ago is not relevant then it should not matter how the state was updated back then). So basically picking every possible subsequence of length N-1 and predicting the Nth is equivalent to the setup we have except just running more epochs. I will try to find the bit of the clip from that video where Jeremy explains this. For a long time when I was working with training RNN I would do exactly as you suggested and extract every sequence of a fixed (or slightly random) length and predict only the next timestep and compute RMSE on only that one prediction . I found this did not improve the ultimate loss on the model, caused the model to train significantly slower, and was much more memory intensive (the dataset becomes huge!).
Now I have a problem I was hoping you could help me investigate. Maybe @marcmuc or someone else in the thread would be kind enough to help as well. I’m attaching a notebook which demonstrates the problem. This is in regards to my idea of implementing multi-image classification. Say you have two (224x224) RGB images and batch_size is one, we can take the two tensors (1,3,224,224) and concatenate them into one tensor (1,6,224,224) where the first 3 channels is fed into one resnet core, the next 3 is fed into a second, and the output is concatenate to be fed into a linear classifier. I notice you have had very good success with combining 3 images for the olive oil classification task, and your method involves sending each as a greyscale image (one in each channel) is that correct? I think this makes sense since the color here is not relevant (its generated by a somewhat arbitrary heatmap for our GADF/RP/MTF etc.) However I still want to experiment with my setup because it will allow us to use arbitrarily many images (within limit of memory) and not limit us to 3 channels. I am attaching a notebook which demonstrates the problem; long story short I have defined the “stacked resnet core” architecture and the “stacked images” dataset and I’m ready to get started with testing except for one big problem… the architecture doesn’t seem to work on GPU for some reason! As you can see in the gist, when I pull the model back onto the CPU it works fine but when it’s on GPU it throws an error. So If anyone has any ideas about what’s going on here… would greatly appreciate it!
EDIT: @marcmuc has solved the problem  thank you very much! Will post a working notebook with some results a little later this week; will take a couple days off for the holiday, cheers everyone!
2 Likes
I’m glad you day you’ll participate!
thanks for the explanation on the RNNs. I didn’t understand you were predicting a sequence. It makes sense.
On the multi-image classification I think it’s a great idea. I was discussing something along those lines, but don’t know enough Pytorch yet to be able to implement this type of approach. But it makes all the sense to be able to combine multiple images and feed that into a NN. I guess there is an alternative approach to your idea, that is to combine the images first, pass them through a convolutional layer, and then load the activations into a resnet model.
I have no idea what’s the issue with your implementation. I have not had any issue, but have only worked with the official prepackaged learn and resnet. I’ve just created images stacking up to 3 arrays as you describe (ts —> encoder —> 1D array —> 1 channel). Sorry I can’t help (yet!)
Excellent Henri!
I agree with you that we’ll need to increase the complexity of the time series challenge to make it more interesting. (Although it won’t be eacy to beat the SOTA, I would guess…)
I just thought it’d be good to start with a relatively simple (univariate) time series problem, and then move on to more complex (multivariate) tasks. We’ll see how this ‘learning competition’ goes, and we can then decide which one to do next.
1 Like
Ok, guys, so based on feedback from @henripal and @mb4310 to my message on the time series ‘learning competition’, and the  from @marcmuc and @Daniel.R.Armstrong I’ll go ahead and create another thread for the Eathquakes problem with the rules I mentioned before. In this way other people who don’t necessarily visit this thread will also see it and might get involved. But at least 5 of us might participate, and hopefully learn from each other. Let’s see how it goes!
1 Like
@mb4310,
I’ve just created a thread to launch the TS learning competition. I was thinking that since you have created a pretty useful notebook to be able to extract data from UCR, you might want to create a gist with the minimum content so that participants can easily upload data into their notebook. It’s just so people don’t waste their time when something is already created. What do you think? At the very least, you’ll have a like from me!..
2 Likes
I will do that when I get home from work this afternoon!
Great! Thanks!!
I will also be interested.