hi @MichaelWoodburn,
In all UCR univariate time series datasets, the target is the first column in the dataframe.
In this particular one classes are -1 and 1 as you thought!
I think these are pretty interesting datasets to get familiarized with some of the time series techniques. Good luck!!
1 Like
Hi @oguiza - I am trying to classify similar images, except that I have a dataset of known good images and a dataset of everything else (or better put images with anomalies). Is there a way to build an image classifier that recognizes the one known class and puts everything else into the other class?
Thank you so much in advance!
Bahar
Hi @baharw,
I’m not clear on what exactly you mean:
Are there 2 classes only: good and bad (anomaly)?
What do you mean by “known class”?
Are you just trying to learn if a picture is good or not (so you are only interested in figuring out whether a picture is good or not)?
If the latter, you should approach this as a one-versus-all problem (multi-label problem similar to planet nb in lesson 3), where you calculate the probability of each class individually and then define a threshold to calculate accuracy.
I have not implemented this myself, but I believe you should use BCEWithLogitsLoss as your loss.
Thanks! I ran the classifier using those classes and got…reasonable results.
I’m still looking for information as to whether class 1 is myocardial infarction or class 1 is normal heartbeat. I’ve tried to contact the paper author through Linkedin.
The text attached to the dataset says:
“The two classes are a normal heartbeat and a Myocardial
Infarction.”
Is there a convention that means that -1 is normal and 1 is myocardial?
Not AFAIK. From DL learning you could called them as they wish. It doesn’t make any difference.
You typically label 1 as the positive class you are trying to learn and 0 or -1 the negative one.
Thank you, @oguiza! This is very helpful. Sorry for the confusing language.
Yes, there are only two classes. A class of known good images (the “good” class) and a class for everything else (the “bad” class). The objective is to identify the good images as “good” and everything else as “bad”.
Your recommendation makes sense. I will try it today and post an update.
thanks @chrisoos
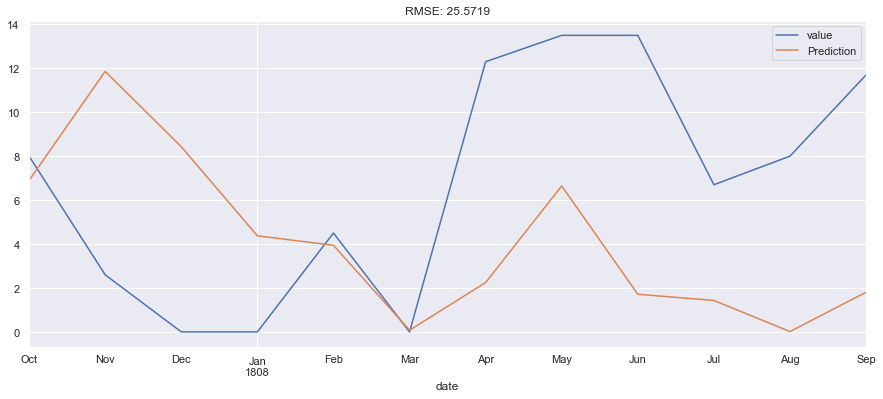
i used seasonal arima as a first try, used ~59 years as train and last 12 months as test, got ~25 RMSE. I will try to use only more recent data like couple of years maybe for training. as i think the past past data is not helping really.
any thoughts, comments on the analysis i did, notebook here: https://github.com/miwojc/time_series/blob/master/time_series_arima.ipynb
thank you!
The technique to transform vectors to images and classify them can be applied to unsupervised outlier detection. For example, we can take time series of stock prices, concatenate TS vectors with themselves (reversed) and get ‘mirror’ vectors/images. Then we can concatenate TS vectors with reversed market index vectors (like S&P 500) and convert concatenated vectors to images and classify mirror and non-mirror images via CNN classification method.
{TS vector, S&P 500 vector} images that are strongly differentiate from mirror images will identify stock price time series that are very different than S&P 500 time series and therefore represent stock price outliers.
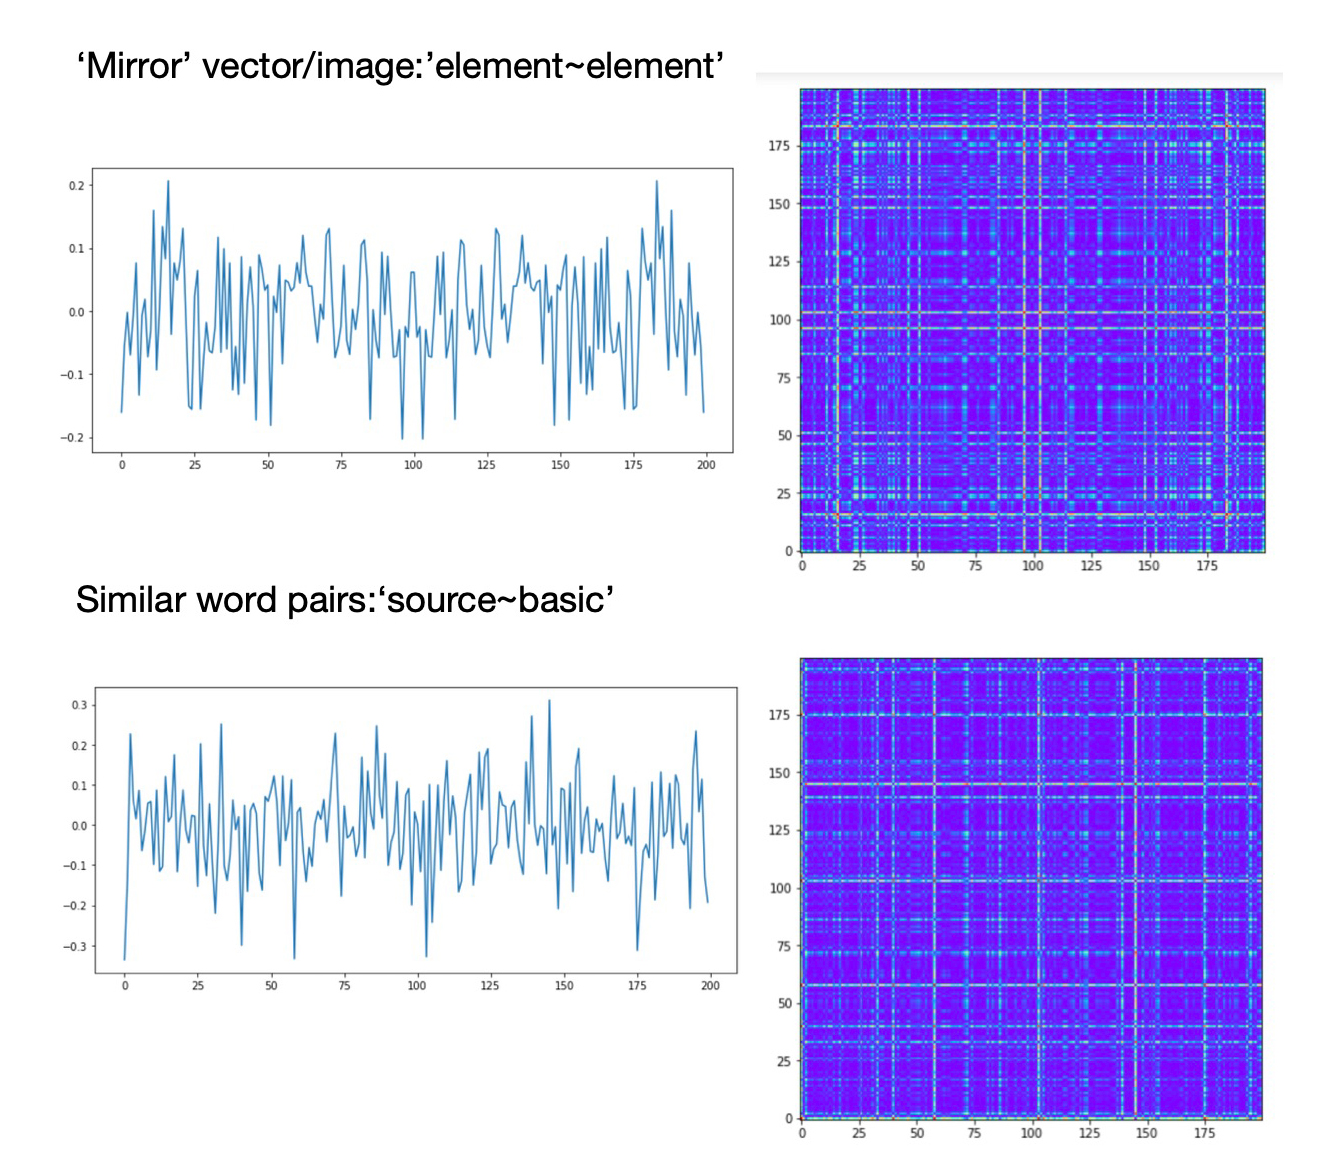
In our post “Free Associations” we applied this method to pairs of words from text file to distinguish between common word pairs and abnormal word pairs, i.e. ‘free associations’. For word embedding we used trained word2vec model. We self-joined word vectors reversing second vectors and transformed them to mirror images. Then we took pairs of words from the text, split them to two words, mapped words to vectors and concatenated vector of the first word with the reversed vector of the second word. These concatenated vectors were transformed to word pair images, combined with mirror images and classified using CNN classification method.
Images that are similar to mirror images represent common word pairs:
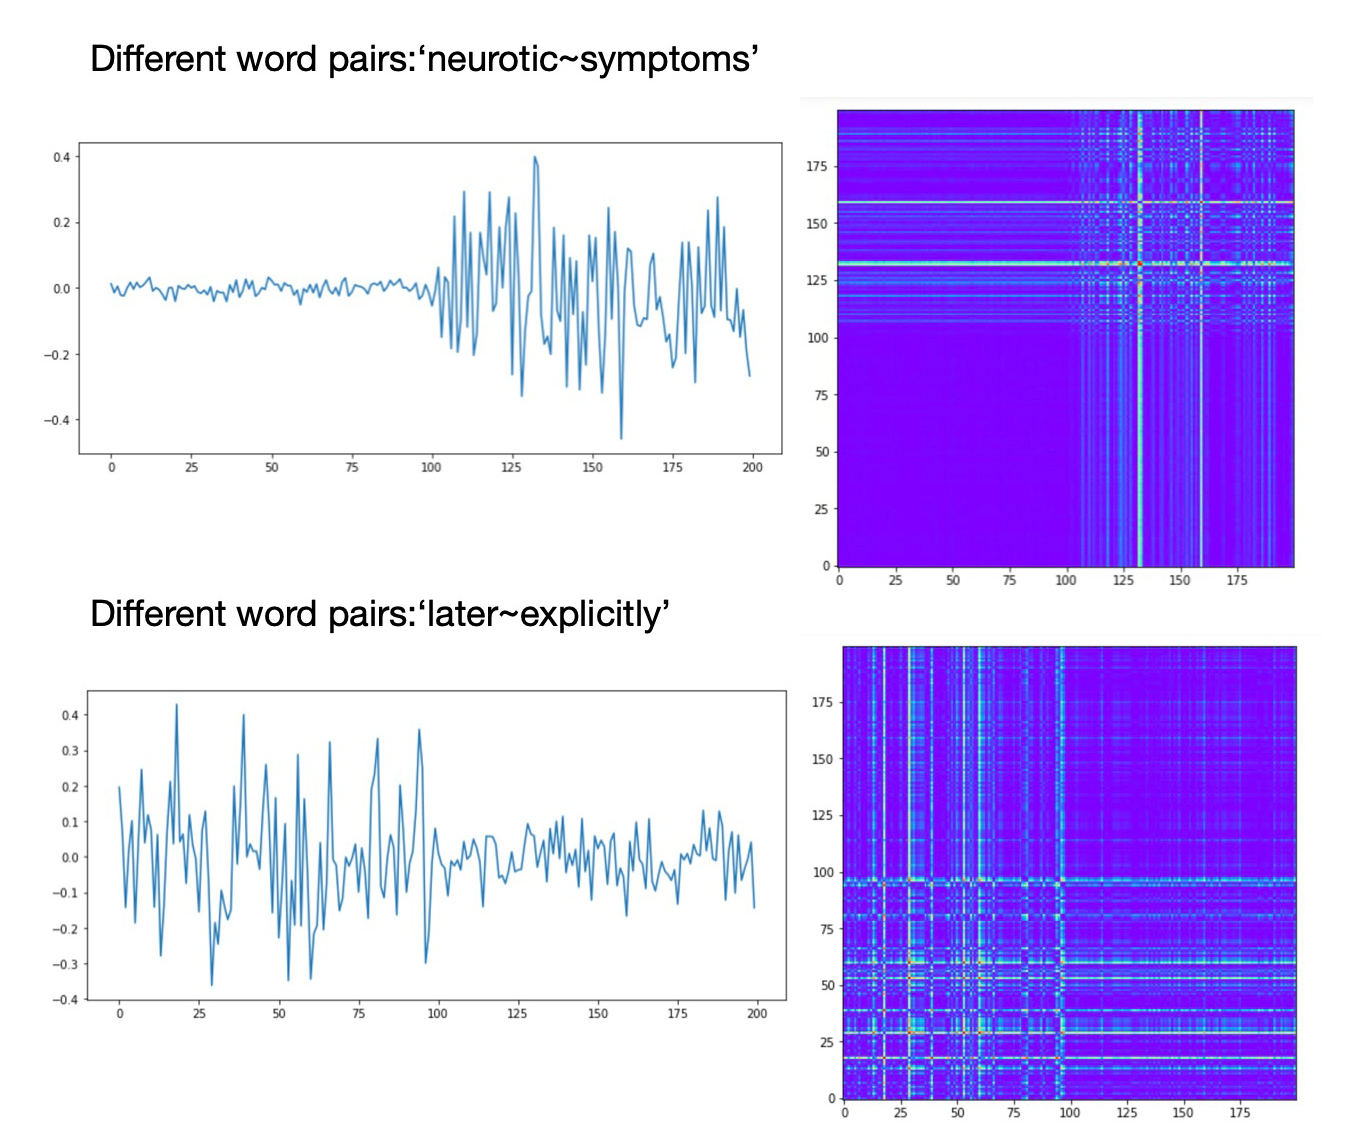
Images that are very different that mirror images represent abnormal word pairs, i.e. ‘free associations’:
2 Likes
@miwojc I’m interested to know what the values are that you are trying to predict.
I have a couple of comments that might be useful:
- ARIMA model is not a deep learning model but a more traditional regression approach. Nothing wrong with it, just that this is perhaps not the best forum to get guidance on it. Consider feeding the data through either LSTM or GRU architectures. These are typical RNN architectures that can handle time series and I believe are able to address seasonality in certain circumstances.
will try to use only more recent data like couple of years maybe for training.
-
Taking a different sample for training might or might not yield better results for your validation and test samples but this will almost certainly not result in a model that will generalise well enough in the real world over time.
-
Depending on what it is that you are actually modelling, past performance might not be a good indicator of future performance. I believe this is fundamentally almost always the case. Are there any other additional data externally that might help explain the trends, seasonality or spikes? Weather, Economic indicators etc that you can also add as independent variables?
-
http://www.statsoft.com/Textbook/Time-Series-Analysis#aarima The input series for ARIMA needs to be stationary, that is, it should have a constant mean, variance, and autocorrelation through time. Therefore, usually the series first needs to be differenced until it is stationary (this also often requires log transforming the data to stabilize the variance). The number of times the series needs to be differenced to achieve stationarity is reflected in the d parameter (see the previous paragraph). In order to determine the necessary level of differencing, you should examine the plot of the data and autocorrelogram. Significant changes in level (strong upward or downward changes) usually require first order non seasonal (lag=1) differencing; strong changes of slope usually require second order non seasonal differencing. Seasonal patterns require respective seasonal differencing (see below). If the estimated autocorrelation coefficients decline slowly at longer lags, first order differencing is usually needed. However, you should keep in mind that some time series may require little or no differencing, and that over differenced series produce less stable coefficient estimates.
In the github repository you set d = 1 in auto_arima object but this might not be enough.
1 Like
thanks @chrisoos ! i just have dates and values i am afraid, no other information.
yeah my goal is to apply LSTM, but wanted to get a baseline in more traditional approach first. would fastai LSTM work for this data? in the course J don’t talk using LSTM for time series…
also is there another forum like this for the more traditional machine learning time series discussion?
i was thinking to use less data for training as the dataset has 60 years worth of data something that was relevant 50 years ago maybe not necessarily still relevant? that was my reason behind that.
i agree, they may be other factors that influence the output, this will be out of scope for this exercise.
i tried manually (using ts.diff(periods=1) ) remove non stationary effect. and it looked like d=1 should be enough but you are right i could let auto arima find better d as well.
Hi guys,
Thank you all for your generous advice and knowledge sharing. I’ve taken what I’ve learnt from this forum thread and put it into a medium blog post. Please give me your thoughts on how it can be better!
Thanks, Yi Peng
2 Likes
never saw this before from medium. no wonder people move blogs off medium for example https://www.freecodecamp.org/forum/t/we-just-moved-off-of-medium-and-onto-freecodecamp-news-heres-how-you-can-use-it/279929
sorry for off topic, but wanted to read your blog post but refused to pay to medium, apologies!

fastai doesn’t really cater for time series data (yet). The only time series module is fastai.text which is focused on language models. It is however possible to write your own model architecture class that uses LSTM.
@Pomo discusses this above in his post here
I think Jeremy presents a course on machine learning Intro to Machine Learning (2018) - fast.ai Course Forums
1 Like
Hi. Thanks for posting. It seems you have found a powerful group of techniques. I look forward to learning from your work, and perhaps suggesting some additional ideas.
I would like to run the notebook but have trouble accessing your data from Google Drive (for example, ‘WSE_labels.csv’).There is a URL in notebook WSE_0_3D_Open_Close_Volume_GAF. Is this supposed to link to your Google Drive with the data? When I run the cell in Colab, it only mounts my own Google Drive. And I do not find the data on Github. Unfortunately, I know very little about Google Drive and Colab, so get stuck at this point.
Thanks for any help you can give for accessing the test data needed to run the notebook.
Malcolm
Thanks for sharing this @neoyipeng!
Very interesting application of vision techniques.
I’ve read your blog and have a few questions/ comments:
- I’ve noticed you’ve used generic image transforms (except flip) in your code. Have you seen any improvement? I personally struggle to understand how That could help since you get images you will never find with real data, but you never know until you test…
- Have you tried combining different encoders in a single image? I’ve run some experiments and it seems to work on some datasets, but not always. An alternative option is to concatenate multiple images (creating a larger, rectangular image).
- I’ve also seen you use focal loss. Have you seen any difference with the standard cross entropy loss? I’ll try it as well.
- In the post you mention recall when I think you mean precision. With a high precision you have very few false positives which is usually the goal. You may want to review that.
- I’m also very interested in applying wavelet transforms to time series. I’ve also started to experiment with scalograms and they seem to work well on some datasets as well. Currently working on improving its speed. I’ve also read a couple of papers on wavelets nets and it seems worth testing them.
Thanks again, and please share any new findings you make.
thanks @oguiza for your feedback. 
-
That is a good point, I actually have not tested not having data augmentation, though I would think it probably doesn’t hurt since it makes the network generalise better? But then again you never know haha…
-
I tried mixing RPs and GAFs but that didn’t really improve performance. Making a bigger image is an interesting one, gotta try that one out
-
Haha yes, I did that after realising there was quite a heavy class imbalance (<10% positive labels), and tested out focal loss and it seemed to improve my results so stuck with it for the rest of the experiment. I recall Jeremy mentioning that class imbalance usually doesn’t matter, but in my case it somehow did? Was worried I did something wrong along the way.
-
Thanks, you’re right! haha rookie mistake

-
Fantastic, thanks for sharing. Many new things to try out! It’s a great time to do DL

Thanks again for setting up this thread and helping us rookies along!
Hi Malcolm,
I did the whole experiment in 2 parts, the google colab notebook runs the fastai stuff after the images are generated with labels. To get the labels.csv, you need to run the first notebook here. Do note you need a quandl api key to get started!
1 Like
Keywords: Gramian Fields pyts time series
A quick question about pyts.
I’m hoping to use it to turn a time series into a gramian angular field. I did something similar to ECG here.
However, I’m aware that with Electrodermal reponse time series, the only difference between the two series may be the scalar dilation. E.g both series are identical under a certain scalar multiplier in the y axis.
Here’s what I mean
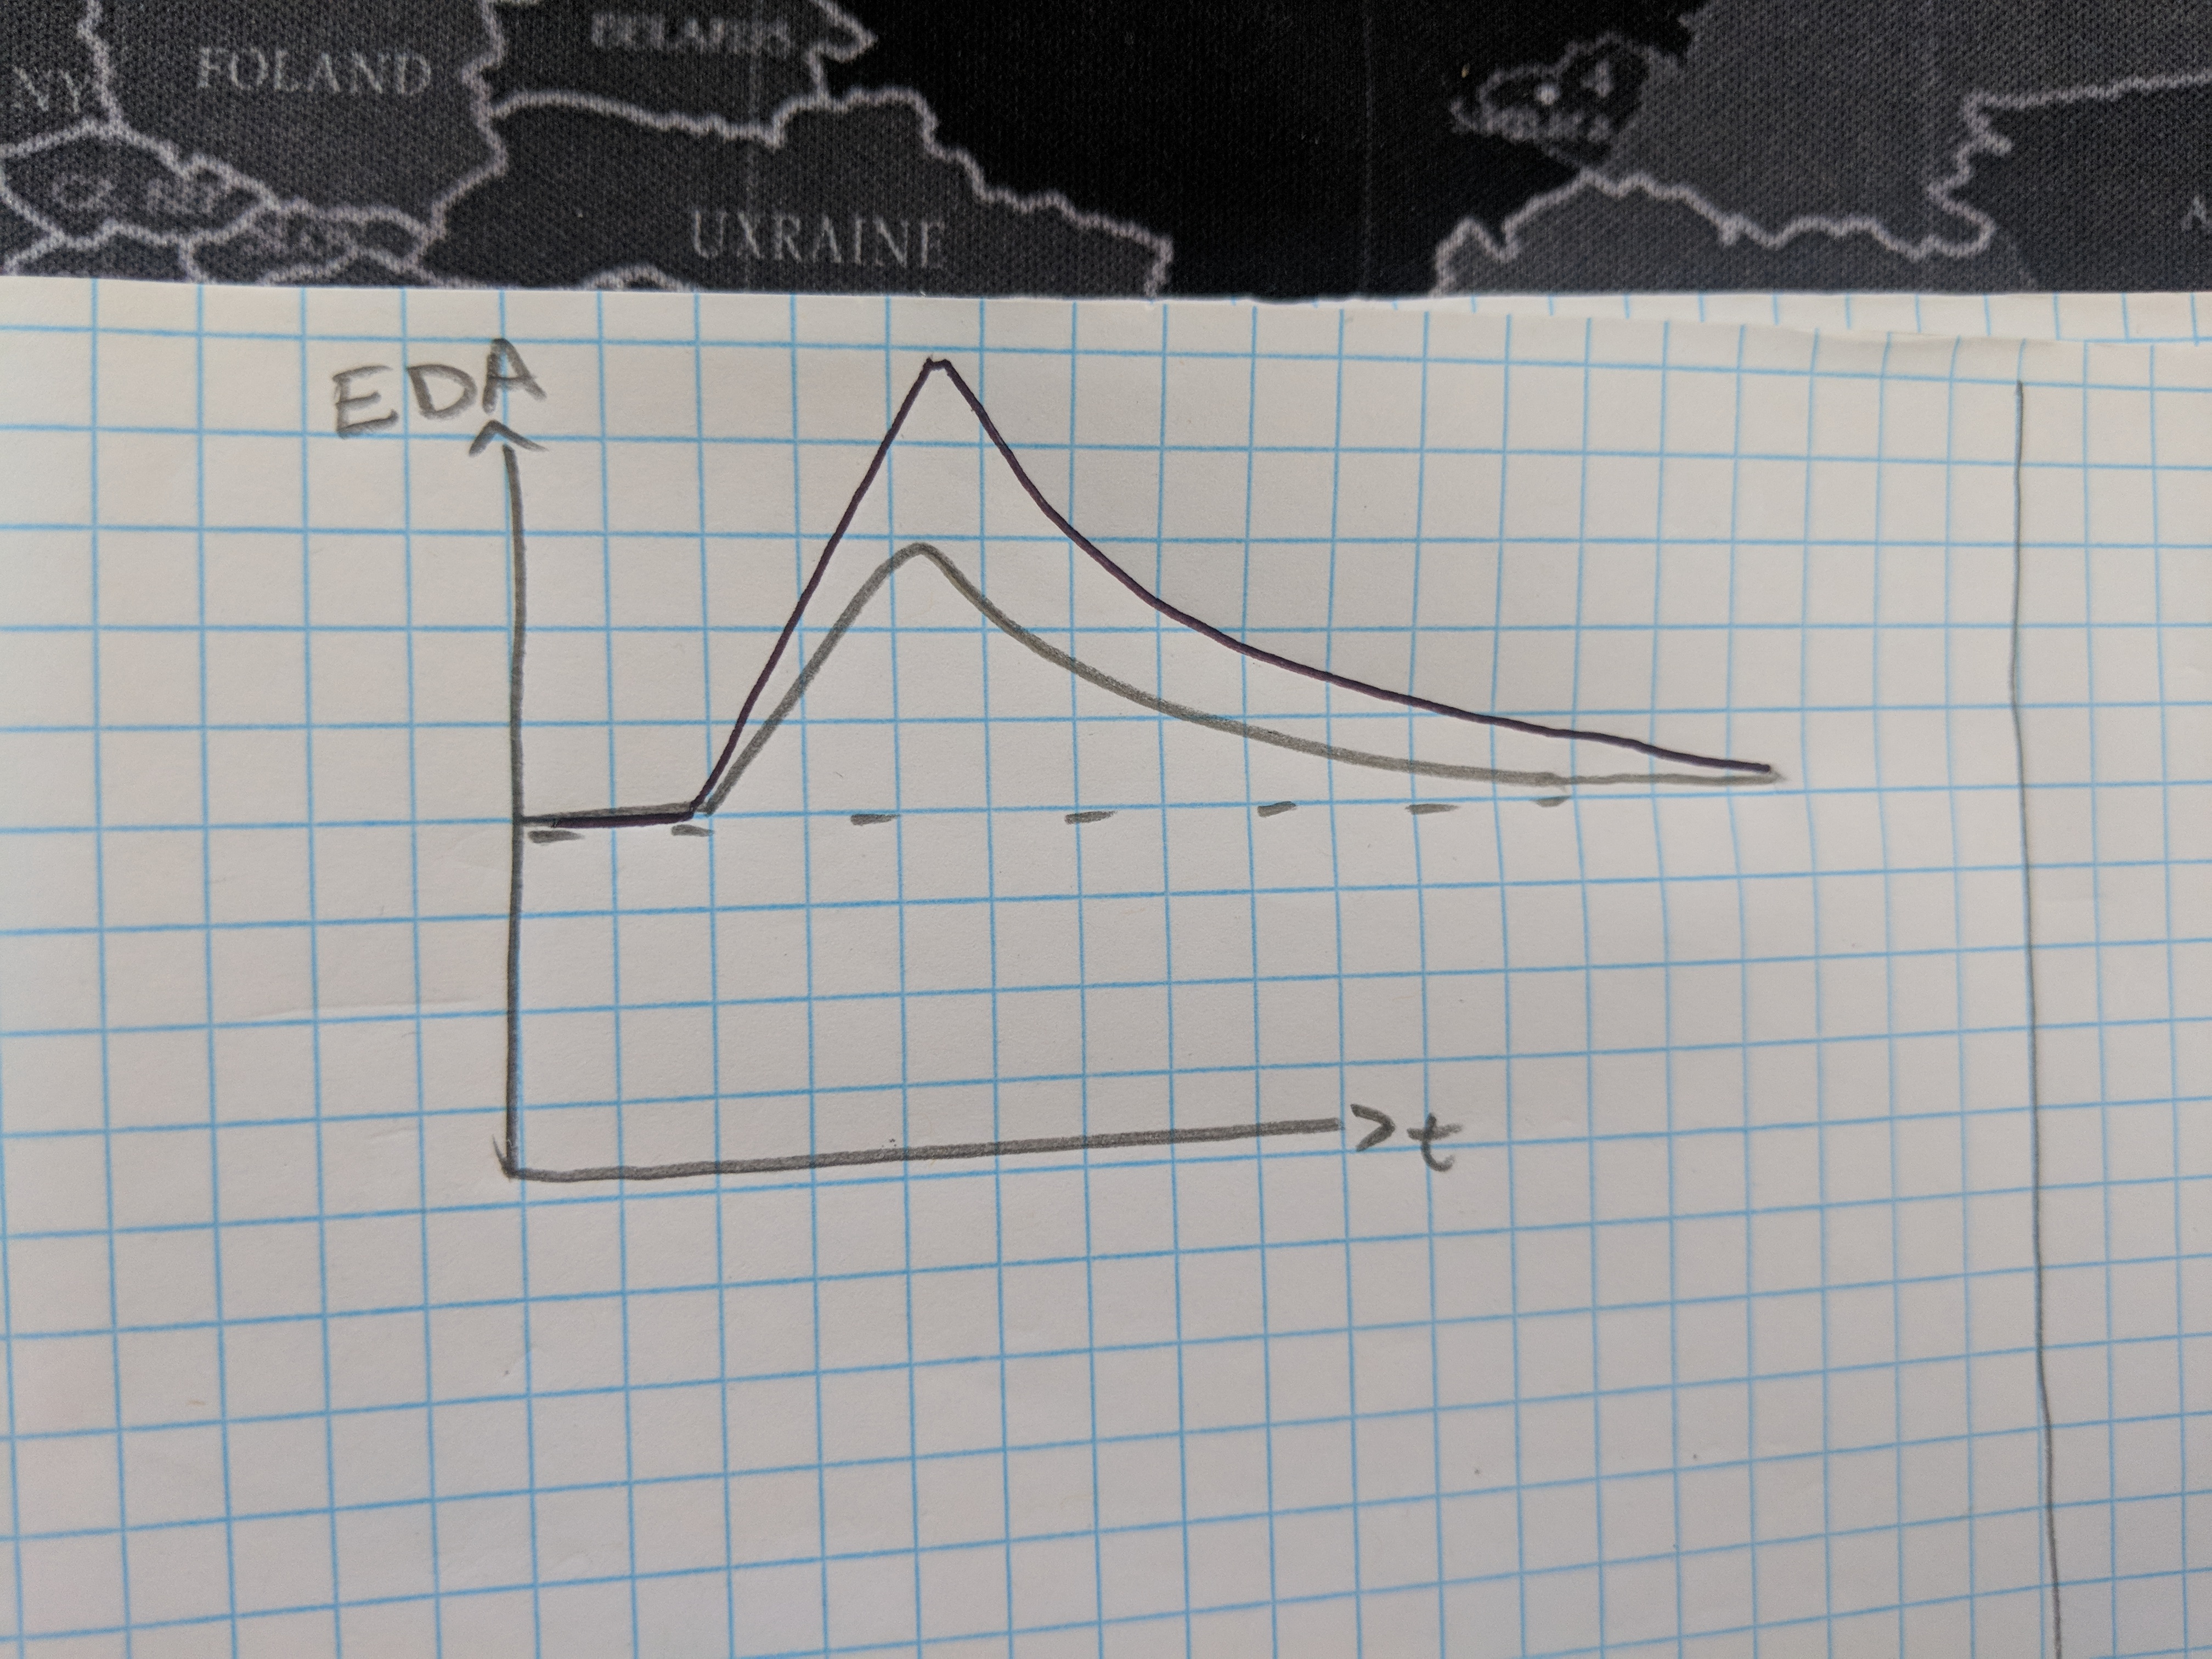
Under Gramian field transformations (with pyts) will both of those time series become indistinguishable?
If so, is there a way to compensate for that effect so the data will be encoded differently in the Gramian field?
1 Like
I have designed a simple solution to this problem.
I normalize all EDR series between two values:
-
The baseline at which they start (varies between series)
-
The value maxraise which is the greatest delta plausible above baseline over all series (this value is constant for any given dataset). I have set it to 50.
     series = create_example_EDA(base,peak,tpeak,half_life)

     absolutemin = base
     maxraise = 50
     series_scaled = []
     for elem in series:
         elem_scaled = -1+2*(elem-base)/maxraise
         series_scaled.append(elem_scaled)
this creates a series_scaled which maintains information regarding the scale of the underlying series whilst also ensuring all values are between -1 and 1.
Work is shown here
https://drive.google.com/file/d/1jFH8fb1sngVslM1J1pexvEBm0mclDX4X/view?usp=sharing
Great question @MichaelWoodburn, and also that you found a solution!
Just wanted to share the approach that I take (based on your same idea), and highlight the importance of a GAF attribute that needs to be used correctly.
I’ve built a notebook with a simple example ot explain why this is so important. A while ago I was making the same mistake, and performance was degraded because of this.
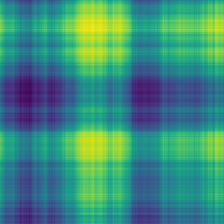
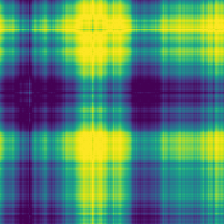
Here’s the link to the notebook, and here you can see how you’ll be able to visualize the difference between same time series with a different magnitude:
class 0:
class 1:
1 Like