Time series/ sequential data study group

I was wondering if anybody has any idea regarding how to pass stacked images as input in FastAI? Also, not exactly sure if I can use a pretrained model such as resnet on this since its not been trained on 6 channel input. I have encoded my time series as recurrence plots – but I want to pass 2 recurrence plots at a time (each recurrence plot is generated from a different time series but they are related) for a single label.

Has anybody tried this before? Please share any ideas/things you’ve tried before. Thanks a lot!

I think it’s important to clarify something. When you apply an image transformation (like Recurre Plot, or GAF, MTF, etc) to a univariate time series you get a 2d squared array (just one channel). If you apply a color map (like viridis) using matplotlib to that array, then you’ll get a 3d array with 3 channels. But you don’t necessarily need to do that.
So if you want to apply 2 recurrence plots to 2 time series (of the same length), you can just create them and then add a third channel that may be all 0s. And you would get an image with 3 channels.
If you truly want to have a pretrained model that takes more than 3channels, you would then need to modify your nn (you could copy the pretrained weights and have as many channels as needed).

Thanks a lot for your reply!
Looks like a ver interesting approach you are following.
Look forward to learning more when you publish your paper! You must have learned a lot from the 88 iterations!!

Hi friends from a couple months ago! After working a ton on tabular data with clients and our learnings from our (almost!) top 100 Kaggle finish, I thought a lot about Excel and tabular data in general.

These past few days I was able to free a little time to work on building a prototype AutoML web app for tabular data!

Obviously you guys are not the primary target audience (except for strong baseline building!!), but I would so appreciate any feedback or input. DM me if you’d like to try the Beta version!!!

1 Like

Thanks for the reply and suggestion Marvin!

Have skimmed the article but I’m gonna dive into that post in more detail.

Would you say that the probabilistic programming approach is the preferred way to deal with deep learning and forecasts? I’m just curious if it’s even possible to do forecasts with the fast.ai-library (or any other “non-probabilistic” deep learning library for that matter).

@MichaelO

TL’DR: Yes you can do a forecast for stationary data with fast.ai (or any other deep learning API) but forecasting non-stationary data especially with variable variance, you do better with Bayesian-based deep learning for not-so-obvious reasons.

And just FYI, 30 Day forecast on non-stationary data, while possible, comes with a ridiculous error that makes it relatively useless in practice so you better have stationary data or settle for a smaller forecast time window.

Long story:

Machine learning roots in statistics and statistics, for the most part, relies on “frequencies” in the sense of which values occur how often in the data. When date are big, you use a sample distribution and approximate the real frequencies and that all works pretty well and thus, no prior knowledge of the data is required.

The Bayesian point of view starts with a prior probability which is based on some previous belief or knowledge you already have. However, with each sample you draw from the data, you update that previous belief to approximate reality as closely as possible.

Matthew Stewart points out that, the “fundamental difference between the Bayesian and frequentist approach is about where the randomness is present. In the frequentist domain, the data is considered random and the parameters (e.g. mean, variance) are fixed. In the Bayesian domain, the parameters are considered random and the data is fixed.”

With statistics and deep learning you have just a single parameter as a result of your estimator (the data is random, the parameters are fixed), but with Bayesian you have a probability distribution over the parameters (the parameters are random, the data are fixed), so you need to integrate to obtain the distribution over your data. That makes the math kinda cumbersome and the modeling a bit harder to understand, but that is what you have deal with whenever complexity increases.

Fundamentally, the parameter frequency in statistic and the parameter probability distribution in Bayesian are really two different ways to look at the same data. And that raises immediately an important question:

When would you use statistic based deep learning and when would you use the Bayesian-based deep learning?

Statistic / Frequency based deep learning excels when:

  1. You have a ton of data. (Law of large numbers)
  2. A single value for each parameter is sufficient to approximate the underlyng function. (Universal approximation theorem)
  3. There is zero prior knowledge of the data (distribution)

When you think about the implications, it makes perfect sense that NN excel at image data because, quite often, you have a lot of images, single values for parameters can be learned extremely well, and since an image actually is just a 2D array of numeric RGB values, you have no clue of data distribution, properties, or whatsoever. Luckily, you don’t have to because of the universal approximation theorem.

Speaking of the forecast problem, whenever you have sufficient data or you can generate more data with augmentation, an FCN can do remarkably well. I measure frequently a root mean squared percentage error in the high eighties or low nineties with the fabulous tabular learner. However, that works only well with stationary or semi-stationary data.

Stationary data reverts around a constant long-term mean and have a constant variance independent of time. Conversely, non-stationary data are just plain random and impossible to predict.

When you generate delta-mean-features, that measure the difference between your y value and any moving average, you capture the stationary part (revert to the mean) of the data and that is technically what you need to predict (y+n). And that is the only thing you cannot do with the tabular learner, which always uses x to predict y, as the underlying linear equation dictates.

As a rule of thumb, whenever you deal with time-dependent and semi-stationary data, it’s going to be really, really hard. it is possible, but ain’t no free lunch here.

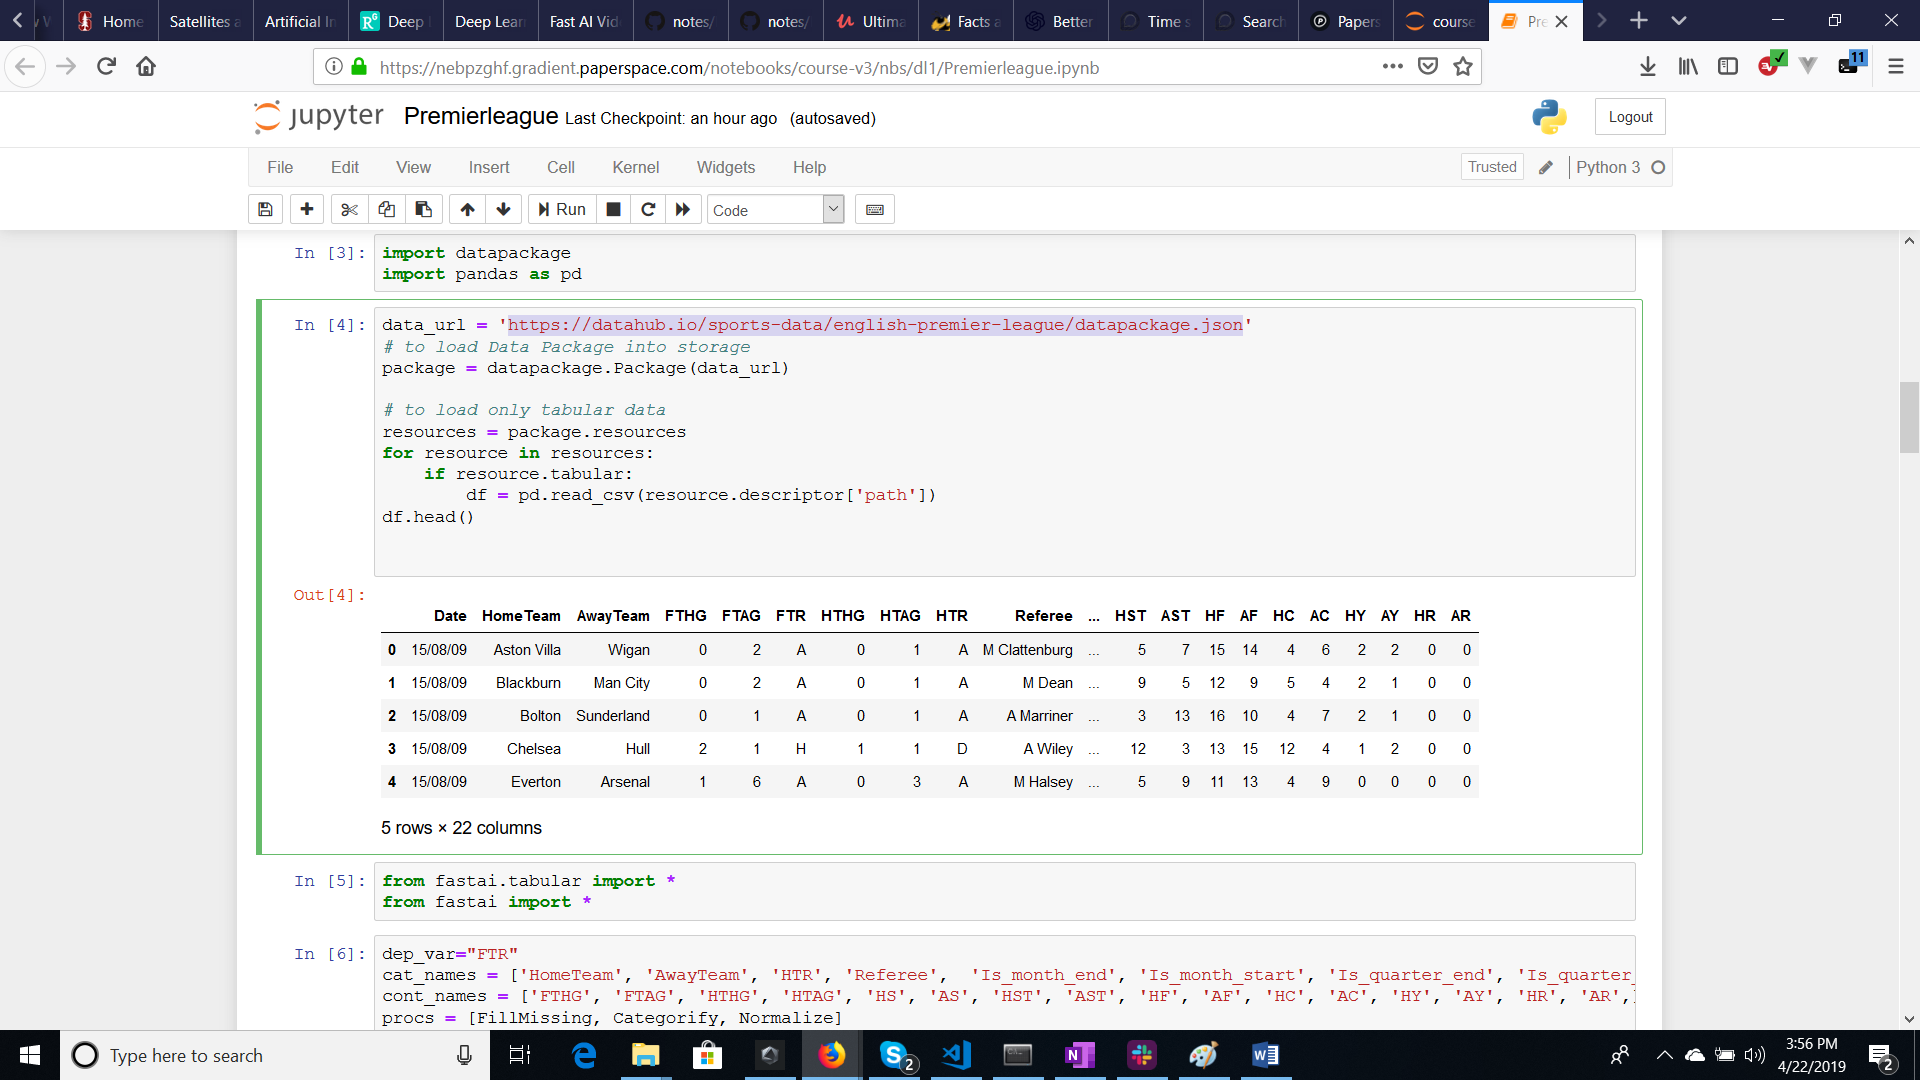
In the Rossman example, you have plenty of exogenous data that are largely non-stationary and so a normal FCN deep network well to predict sales.

When modeling financial markets, you don’t have that luxury because at least variance (volatility) isn’t exactly constant in any asset class.

That brings us to the use case of Bayesian-based deep learning. You use it whenever you have:

  1. Relatively few data (that’s true in finance)
  2. Have a (strong) prior intuitions (from pre-existing observations/models) about how things work (that’s mostly true in finance)
  3. Having high levels of uncertainty, or a strong need to quantify the level of uncertainty about a particular model or comparison of models

The last point is the actual selling point because in quant finance, your day job is to model risk and therefore you must know the degree of uncertainty.

With PyTorch / Pyro you get the luxury of both worlds, that means, you do probabilistic parameter sampling and feed into a nice FCN to do predictions while using GPU acceleration.

To answer your question, yes you can do a forecast for stationary data with fast.ai (or any other deep learning API) but for a forecasting non-stationary especially with variable variance, you do better with Bayesian-based deep learning because then you use variance distribution instead.

Hope that helps.

7 Likes

It’s amazing group - thank you @oguiza for organizing it!

This technique can also be applied to transform vectors to images to classify them via CNN Deep Learning. And so many things can be converted to vectors: ANYTHING2VEC

In our blog sparklingdataocean we transformed long text to words, words to vectors, words and vectors to graphs, and used the method to validate topic discovery:

We’ve got about 91% accuracy which potentially can be improved using more advanced Word2Vec models.

Hello everyone,
This is my very first post and I am so glad there is a topic for time series data.
I wanted to build a predictive model for Football (Soccer) data. I first started by looking at Premier League data from ‘https://datahub.io/sports-data/english-premier-league/datapackage.json’ .


Then I added the ‘add_datepart’ columns and replaced the categorical targets to integers.

Followed by a walk forward train, valid and test split as it is Time series.

Got this as a result:

Beyond this point I am stuck with how to use the data block api to build my data bunch. As well as, chosing the right layer size and final activation function to narrow down my result to either a 1(Home Win),2(Away Win), 3 (Draw). I attempted to follow the rossmann procedure.
Any help or pointers would be very appreciated. I can most likely help you with another topic so I hope it is worth your time helping me. I am also available to communicate elsewhere like Skype.

Thank you,
Ethan

3 Likes

I may be wrong here but couldn’t you save all the train, test, valids into a single csv for each and go from there? Or would that lose the time relationship?

I believe it will lose the time relationship and I am not sure if I can just load my trained model and train it further with every new csv file?
Thank you so much for your reply and suggestion.

Hi @Ethan7,
Thanks for sharing your problem. It’s an interesting temporal sequence problem!
To use a walk forward approach like you have previously shown, you will have to create a loop for each of the wf folds, and create a databunch and train the model within the loop.
If you combine all train, all val and all test indices, you’d be then using val and test data during training (leakage).
Once you get this running, you may also want to test how much history you need to get a good outcome. You could this by using different train/ val-test size ratios.
I think it’d be also good to try a boosted tree model (like LGBM) to have a baseline comparison. Boosted trees are sometimes difficult to beat in temporal sequence problems (where the order of elements is important, and time is another independent variable).
Temporal sequence problems (like Rossman) are a bit different from traditional time series problems (where observations are in order, with a fixed time-difference between occurrence of successive data points).
In traditional time series problems, deep learning tends to work very well (may be due to the continuity of the data).
I’d be interested to know your progress on this problem!

If you want to predict one of (1,2,3), you have to treat this as a classification problem, Rossmann is a regression problem iirc.

You have to be careful in what you use as features with this dataset. For example, by using home goals and away goals as features, you will obviously be able predict the (1,2,3)-outcome. A lot of the features in this dataset are statistics for the match that you probably want to predict before the fact. One way to address this is to create “lagging” features, e.g., numbers of goals scored in the match before the match you want to predict, or some kind of moving average.

Yes, exactly like this. Within your walk forward loop, use the data block api for each set of train/valid/test indices to create a databunch. Then, train your models independently and store the results away.

Lots of models could work, LGBM very likely is a good bet with reasonable feature engineering.

1 Like

I am confused on this. Do I train the same model on multiple databunches? Or is it multiple models being made, one for each step?

Thanks!

If you have, let’s say 10 folds, you would within each loop iteration:

  • create a databunch (including test set if necessary)
  • create a model
  • get train and val metrics
  • create and store test predictions

Now when you create a model you would train from scratch in the first fold.
For subsequent folds (2-10) you could start from scratch with a new model or fine tune the previous one (there would be no leakage involved).
I think you would probably get better results by fine tuning than training from scratch as you would normally do when you have a trained model and get new data.

1 Like

Thanks for the clarification! And I guess I have a question. I’m trying to identify movements over time based on a variety of sensory inputs. I’ve had initial better results by taking a walking mean over the past 7 instances, but I want to take it a bit further. Would this be something where the above could be applied best? Or how should I go about this? Any advice would be appreciated. I have 7 movements in total I am trying to classify and 8 different participants who provided data.

If you need to perform some feature engineering, you should first sort out data by date, and then calculate all features you need. Once you have all data (including train, val and test) you can apply the walk forward scheme proposed above. So short answer is yes, you can use this approach with any number of predefined or calculated features.

Thank you for the clarification! My last question (I hope) is how is there not data leakage in having your validation and test eventually become your training? Would it not be better to have your test set never change and have it be the last little bit of your dataset?

You should think of each walk forward fold in the loop as a different experiments (see chart in Ethan’s previous post). There’s no leakage as long as you sort all data by date before before applying the walk forward scheme.
When you finish a fold, you start a new experiment with a different databunch. It doesn’t matter that previous val or test data now become train, because the important thing is that current val or test are not seen during training.

Thanks again Marvin! And wow, I really appreciate your detailed answer, many interesting thoughts and reflections.