Maybe I am not getting something, but using resnets and CNN is for classification purpose no?
I have equally spaced data (5min) for each TS.
Not necessarily. MLPs, RNNs and CNNs can all be used for forecasting problems.
The ResNet model I talk about is a model with a resnet-like structure, but adapted to time series (this is described in the link I shared before). Instead of hading 2d convolutions it has 1d convolutions. The rest is similar to a traditional resnet model.
This TS ResNet model takes an 2d array as an input (not an image) but the filters are only convolved in 1 dimension along the time axis.
In this case, instead of predicting classes, what we want is to predict an amount. So the output of the last fully connected layer will be a single float instead of multiple floats (one per class). So classes should be set to 1. The other thing you need to do is to use an adequate loss (like for example MSELoss) and the metrics you want to optimize.
My data looks like this:
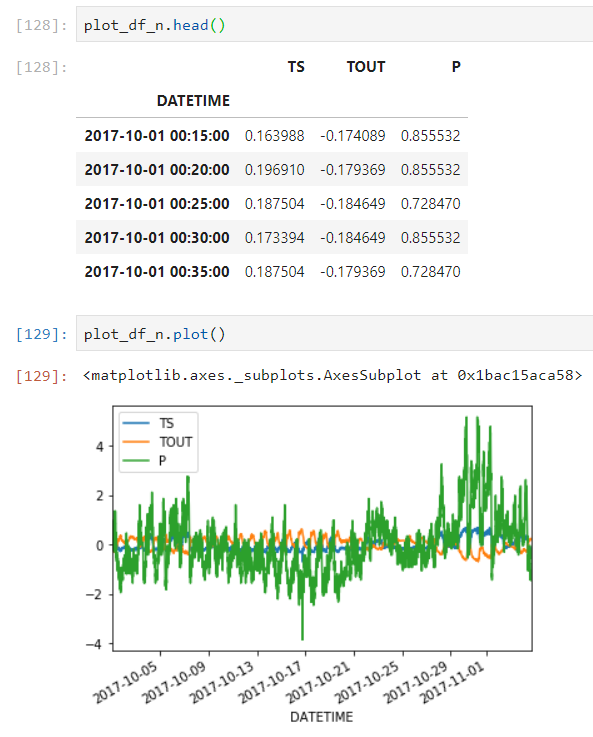
I am trying to forecast P as a function of TS, TOUT and the Date, I am currently working with Tabular model and XGboost, but it is not working that good.
Also, my model will act as Control, so I want to use it online and update with the real values of P that I will be getting.
I get your idea of 1D - Resnet , but how you would set up the data to train such a model?
Would you cut the TS in smaller pieces, for instance in n+1 values, where you would use the n preceding values to predict the n+1? How would you incorporate Dateime data (categorical)? Would you join a tabular model to the output of the feature map of the resnet?
1 Like
One option would be to split data first between train and test (or train, val and test), so that there is no overlap between them.

This example, just includes 1 val and 1 test fold, but you could have more using a walk-forward approach.
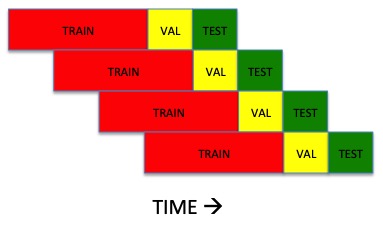
Now, within each of the datasets, you will need to use a sliding window to create the X_train, y_train, etc as you describe. You would have 2 features (TS and TOUT). So if your sliding window is of size 20, you would create an 3d array of size (n_samples, 2, 20). In this way, none of the train samples would overlap with val or test samples.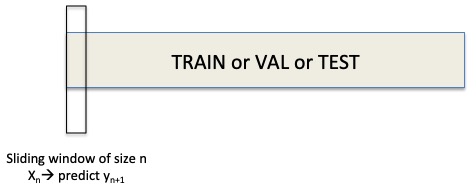
As to time, it really depends whether you think it has some predictive power or not, and how long your sliding window is. You could extract features from time like minute, hour, day/night, day of week, month, etc if you think those could have an impact on the prediction. You could treat those time features as the other 2 features. If you have extract 1 time feature, you would then feed an n_samples, 3, 20 shape array into the model.
I mentioned ResNet and FCN becuase they’ve been shown as effective multivariate time series models, and may give you a good starting point. But of course you may also use many other models: non-DL, LSTM, GRU, etc. or hybrid models.
4 Likes
Do you have an implementation of this? An example?
Time series walk-forward validation and sliding window
You can find here an example of how you can create one or multiple walk forward folds, as well as how you can use a sliding window approach to create the train, val, (test) datasets from a single array.
Bear in mind you don’t necessarily need to use multiple folds in walk forward. You can just select a single fold (with train and val -and test if you wish so-), and the create the 3D array using the sliding window.
I haven’t tested this code very thoroughly, so it’d be good that you use it with caution.
3 Likes
Thanks, I was mostly asking for a model implementation, I had created something similar to build my dataset:
def sliding_window(data, window=20, step=5):
    "Creates a new Tensor of windowed data every step"
    num_pieces = int((data.shape[1]-1-window)/step); num_pieces
    X = []
    y = []
    for j in range(num_pieces):
        X.append(data[:,step*j:step*j+window])
        y.append(data[-1,step*j+window+1])
    return torch.stack(X) , torch.stack(y)
With this, I have a dataset that is
X.shape, y.shape
>>(torch.Size([70270, 3, 24]), torch.Size([70270]))
I was trying a naive Convnet, but it does not seems to work at all:
basic_conv = nn.Sequential(nn.Conv1d(3, 32, 3),
                           nn.Conv1d(32, 64, kernel_size=3, stride=2, padding=1),
                           nn.Conv1d(64, 64, kernel_size=3, stride=1),
                           nn.Conv1d(64, 128, kernel_size=3, stride=2, padding=1),
                           nn.Conv1d(128, 128,kernel_size=3, stride=1),
                           AdaptiveConcatPool1d(),
                           Flatten(),
                           nn.Linear(128*2, 512),
                           nn.ReLU(),
                           nn.Linear(512,1)
                           )
Any recommendations?
Thomas,
Thanks for sharing your thoughts. The first thing you need to do is a test for random walk. To do so, you take previous value, store it in a separate column, and plot a correlation matrix.
Two scenarios:
Low correlation: means you can spin around the universe and it’s not going to get better. If the current value does not correlates with the previous (n) , it’s all random walk and there is not much you can do.
High correlation: Great, all you need is better features and a better model.
If correlation is somewhere in the middle, you may get around by converting the data into stationary by calculation the first and second derivatives. Plot a correlation matrix to see how that compares.
In terms of better features, you can use ta-lib to calculate a myriad of time series features widely used in finance.
Also,you need to categorify the date to capture trends.
However, the standard correlation matrix isn’t terrible useful for features assessment so you actually need to to a feature ranking in xgboost.
Hope that helps
Marvin
1 Like
I have a version that works “betterish” now:
class ResLayer(nn.Module):
    "Resnet style layer with `ni` inputs."
    def __init__(self, ni:int):
        super().__init__()
        self.conv1 = nn.Sequential(nn.Conv1d(ni, ni, kernel_size=3, stride=1, padding=1),
                                   nn.BatchNorm1d(ni),
                                   nn.ReLU(inplace=True)
                                  )
    def forward(self, x): return x + self.conv1(x)

def basic_conv(out):
    return   nn.Sequential(nn.Conv1d(3, 32, 3),
                           nn.Conv1d(32, 64, kernel_size=3, stride=2, padding=1),
                           ResLayer(64),
                           nn.Conv1d(64, 128, kernel_size=3, stride=2, padding=1),
                           ResLayer(128),
                           AdaptiveConcatPool1d(),
                           Flatten(),
                           *bn_drop_lin(128*2,256, p=0.5, actn=nn.ReLU(inplace=True)),
                           *bn_drop_lin(256,512, p=0.3, actn=nn.ReLU(inplace=True)),
                           nn.Linear(512,out)
                           )
I created a windowed dataset to predict the next N points, as I have a sample every 5 mins, predicting 6 points seems to be enough for the application I want (30 min).
I don’t get the correlation idea, do you want me to check if the dep_var has a trend?
What I really need is to forecast the future of the Power, as accurate as possible for the near future, using the past values of P and the past and current values of T and time data.
1 Like
Hi, have you tried with tsfresh yet? It automatically extracts features from your time series.
Here’s an example using tsfresh for forecasting: https://github.com/blue-yonder/tsfresh/blob/master/notebooks/timeseries_forecasting_google_stock.ipynb
Works with rolling window already. My experience with Tsfresh + XGboost has been good. Or you could just extract features and then use those on a deep model.
1 Like

1 Like
Who is interested in joining the second Time Series Learning Challange:
“Predict the S&P500?”
We have:
~ A draft of the challenge
~50 years of data
~ A simple notebook to load and split the data.
~ A fairly large sample notebook for data pre-processing
There are a lot of time series data out there: Sensor data, climate data, IoT data and you name it. However, predicting a time series correctly and reliably is often challenging in practice due to the inherent complexity with the stock market being notoriously difficult to predict. Can we do it? So let’s tackle it and crack the S&P prediction challenge together.
Some crazy ideas:
- CoordConv (Paper) (Repo) (Ueber)
- Pytorch + pyro
- Deep Neural Network Ensembles for Time Series Classification: SOTA
- Bayesian Convolutional Neural Network
- Time series feature engineering with tsfresh
- Transfer learning
- And more, please add in the comments
If you have any questions, please don’t hesitate to post your question!
Special thanks to Oguiza for leading the first one and inspiring the formation of the second one.
5 Likes
Yes, it does.
There’s a key difference though: in the walk-forward validation, train, val and test samples are created in time order, while in nested cv the dataset is usually shuffled.
Sorry, I misunderstood you.
My recommendation if you want to start with the raw data, is to use either an LSTM, or a convnet (FCN, ResNet). You’ll be able to find these last 2 models in Keras here.
That should give you a good starting point for raw times.
I understand that you want to predict future values based on past ones. There is a nice tutorial on getting started with time series with afocus on trends and correlation.
To do so, I suggest conducting a correlation test whether there is a statistical significance between past and present values to determine whether you can use present values to predict future values.
The correlation coefficient of two variables captures how linearly related they are. If there-there is no (linear) relation between present and future values, how on earth can you make any useful prediction of future values? How do you know there is one?
A random walk dataset would have only a low correlation coefficient between the last and current value. That is exactly when you know that past values have no impact whatsoever on future ones. It is just random crap and no model in the world can predict that. To do a proper test, you add the (n) previous value of the target value to the feature set.
n = 1
X[“last_value-”+str(n)] = y.shift(n)
When you take a closer look at the RF Ada Boost model discussed in the tsfresh example, you noticed in the feature importance ranking that “feature_last_value” contributes to 88.5% of the accuracy while all the 347 features generated by tsfresh only added an accumulative 1.5% to the prediction.
Three insights:
-
You need to know the correlation coefficient between the past n values and the current value to figure out whether you are barking up the wrong tree.
-
To capture seasonality, cycles, and trend in time-series data, you need to categorify the date field. Jeremy made that abundantly clear in the lessons and also stresses it in the data preparation section of the Rossmann example
-
When adding tsfresh generated features, expect a 1 - 2% impact, as they demonstrated in the Google example. Turned out, many generated features suffer from low importance so ideally, you want to add correlated external data.
Hope that helps.
1 Like
Hi all, I have been reading up on this thread as I am currently doing research with time series data. I’m wondering how best to split my data? It’s set up as 6 different events in 6 separate csv files and the goal is to identify what event it is given one column. I’m debating on a rolling-event style but I’m lost in how as each one has a sepearate time value which id like to ignore completely. I had very poor results with just a standard 80/20 random split (which would make sense as we are time trending data?) How would you recommend I select my ‘walk’ given the nature? Just do a walk with my validation being combined with all the events?
Thanks!
Zach
Hi everyone,
I’m fairly new to time-series analysis/prediction but have been asked to work on time-related live oil and gas data nonetheless. As a part of this, one of my first challenge is to remove unwanted noise from multiple data streams where most of them are related to each other, such that if we see a fluctuation in multiple of them at a time, then the data is valid but suppose if only one parameter fluctuates that is to be removed (kind of like a trend line I guess).
I have been trying to find methods to do so by searching for noise reduction/despiking techniques for multivariate data but haven’t had much luck in finding something useful. Does anyone have any tips on how to approach this problem?
I did look at techniques used in Human Activity Recognition models, but it wasn’t of much use.
While going through the forum, I saw @marcmuc has worked with energy related time-series previously, do you have any pointers sir?
P.S: Later I’ll have to use this cleaner version of data to make predictions for other datapoints and anomaly detection as well.
Hi Akshay, there are many possiblilies in this area and it and depends very much on what your raw data is like and what you would like to achieve with it. It is also important to see, whether the data is supposed to be monitored in some “online fashion” as it is received, or whether you are doing analysis “offline” on historical data. But the prepping process for timeseries often is the most time consuming  Dealing with missing values, with false zero values, detecting and removing false peaks/outliers, denoising, detrending. Regarding peaks if you know the bounds of your possible values exactly sometimes it is as easy as using hard thresholds, most often that doesn’t work though.
This is not a “solution” for you, but some suggestions of what you can look at regarding denoising / peak stuff and you can find some code here that you can test on your problem. Your solution will probably involve multiple steps and could use a combination of features gathered from these:
This kaggle kernel from the recent VSB Power Line competition shows nicely how denoising using DWT (discrete wavelet transforms) is done and aso shows high pass filtering. Results look like this:

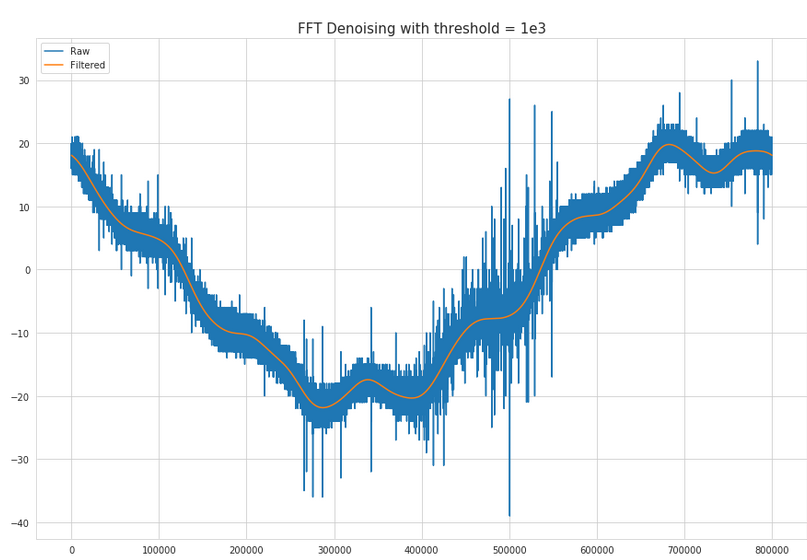
This kernel from the same competition compares denoising by mean and denoising by Fast Fourier Transforms (FFT). Results:
A helpful metric wrt peaks is the “z-score”, these algorithms help you detect peaks when you have timeseries that are changing over time and you cannot use hard thresholds for peak detection by using rolling windows. Check out this helpful SO answer with a good explanation and links to implementations. The result looks something like this:
So you can detect peaks and then use this information in the next step (in your case use this output and then verify that this peak is present in “all” parameters of the multivariate series (could be as simple as using logic (A & B & C) or if a percentage of all parameters is relevant then by adding it up and using a threshold (A+B+C >= 2).
Maybe doing this “manually” is not necessary though, multivariate models like FCN or Resnets also detect these things “on their own” depending on how much training data you can provide etc. So you have to experiment here.
8 Likes
Ah, and there is actually a python lib called “peakutils” for peak detection stuff, I have not used it much though so far…
2 Likes
Thanks for the complete answer!
I have already played with Rossman back in V2 of the course and used this kind of tabular/xgbosst techniques before, but for this particular problem, the other TS are not that correlated to the dep_var, so using a regressor is not good enough. That’s why I was trying to understand and implement a more “financial” + regressor approach.
I am particularly interested in the GAN techniques just for how fun they sound. I have already done the “random Walk” test, and the last three values are super important, checked with XGboost and the feature importance puts them higher than everything else.
- I can make a regression of P as function of T and TS with “descent accuracy”, but not good enough.
- I have and external model to forecast T and TS precisely for the next 24h
- I want to use all this to predict a better P for the next 24 hours
- I have 24 months of data, sampled every 5 min.
- I may get 2 other TS, (wind and irradiance)
Just to give more insight, P is the power of a central heating system, TS is the temperature of water exiting the system, T is the ambient external temp.
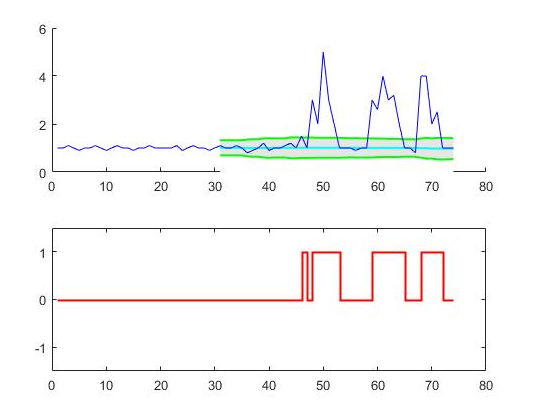
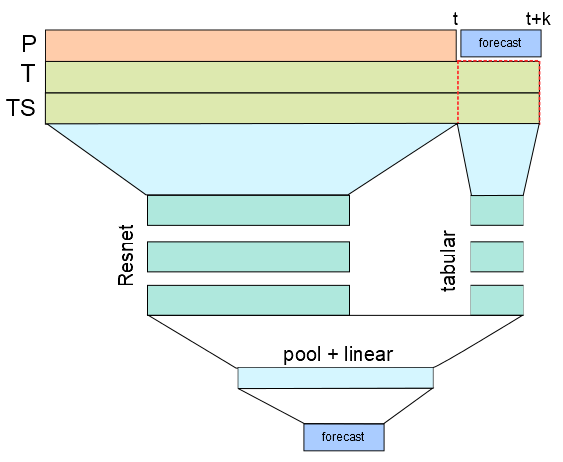
I made some progress today:
I built a model that takes as input the past (24 hours) plus the forecast of the Temperatures and predicts the Power P for the next 6 hours.
I treated the past 24 hours with a ConvNet and the forecast of the explicative variables with a Tabular model. Then I mixed the feature map of the ConvNet with the output of the tabular model appending a classic resnet head.
The output is pretty good, probably my architecture is kinda of noobish, so suggestions are welcome!
My Dataset is a Double input dataset, just to concatenate both different size arrays (TimeSeries):
class DoubleDataset(Dataset):
    def __init__(self, X, X2, y):
        self.X = X
        self.X2 = X2
        self.y = y

    def __len__(self):
        return self.X.size(0)

    def __getitem__(self, idx):
        return (self.X[idx], self.X2[idx]), self.y[idx],
and my model:
def basic_conv():
    return   nn.Sequential(nn.Conv1d(3, 64, kernel_size=3, stride=2, padding=1),
                           ResLayer(64),
                           ResLayer(64),
                           ResLayer(64),
                           AdaptiveConcatPool1d(),
                           Flatten(),
                           )
def tabular_model(inc:int, out_sz:int):
    layers = [Flatten()]
    layers += [nn.Linear(inc, 1000)]
    layers += bn_drop_lin(1000, 500, p=0.01, actn=nn.ReLU(inplace=True))
    layers += bn_drop_lin(500, out_sz, p=0.001, actn=None)
    return nn.Sequential(*layers)


class mix_model(nn.Module):
    def __init__(self, inc:int, out:int):
        super().__init__()
        self.cnn = basic_conv()
        self.tabular = tabular_model(inc, out)
        self.head = nn.Sequential(*bn_drop_lin(64*2+out,256, p=0.1, actn=nn.ReLU(inplace=True)),
                                  *bn_drop_lin(256, 256, p=0.01, actn=nn.ReLU(inplace=True)),
                                  nn.Linear(256,out)
                                 )
    def forward(self, x1, x2):
        y = self.cnn(x1)
        y2 = self.tabular(x2)
        y3 = torch.cat([y,y2], dim=1)
        return self.head(y3)
5 Likes