Getting the attention weights and plotting them as a bar plot (feature => score in [0;1]) would be a good start.
With that you can interpret a single prediction or a batch of prediction (averaging the weights over the predictions)
Getting the attention weights and plotting them as a bar plot (feature => score in [0;1]) would be a good start.
With that you can interpret a single prediction or a batch of prediction (averaging the weights over the predictions)
@nestorDemeure it’s already available in pytorch-tabnet 
With this, we’d probably want to sub class Interpretation for specifically the TabNet learner to incorporate it in with the rest (most confused, top losses, etc). We could do interp.attention and pass in either a row index or a row itself
@Optimo Any plans to make a package release with my PR? I’m going to delete the duplicate code from my package when it arrives.
hey @grankin, we will make a new release today, sorry we delayed a bit for extra improvements. Thanks again for your PR!
We released a new version including your changes! Sorry again for the delay!
@Optimo Thank you! I’ll release an updated version soon 
BTW @grankin and @Optimo I believe I have attention working, please tell me if it’s how you’d expect…
My modifications:
To our model @grankin I included an att parameter, if True then we go ahead and return the mask information:
        x, m_loss, m_explain, masks = self.tab_net(x)
        if self.y_range is not None:
            x = (self.y_range[1]-self.y_range[0]) * torch.sigmoid(x) + self.y_range[0]
        if att:
          return x, m_loss, m_explain, masks
        else:
          return x
From there, I got our cat_dims by doing:
cat_dims = [emb_szs[i][1] for i in range(len(emb_szs))]
And then the cat_idxs are the index in our batch the categorical variables come in. In our case this is everything after 3 (as I was using adults), so cat_idxs = [3,4,5,6,7,8, 9]
From there we need to make our explain_matrix like so, where tot is the total length of to.cont_names and to.cat_names:
matrix = create_explain_matrix(tot,
                      cat_dims,
                      cat_idxs,
                      42)
And then 42 we see in the model as the input. Finally to do the attention here is where things get a bit tricky. See below:
dl = learn.dls.test_dl(df.iloc[:20], bs=1)
So first I make a quick bit of data with a batch size of 1. From there I do the explaining via (and this is almost the same as what @optimo has):
learn.model.eval()
for batch_nb, data in enumerate(dl):
  with torch.no_grad():
    out, M_loss, M_explain, masks = learn.model(data[0], data[1], True)
  for key, value in masks.items():
    masks[key] = csc_matrix.dot(value.numpy(), matrix)
  if batch_nb == 0:
    res_explain = csc_matrix.dot(M_explain.numpy(),
                                 matrix)
    res_masks = masks
  else:
    res_explain = np.vstack([res_explain,
                             csc_matrix.dot(M_explain.numpy(),
                                            matrix)])
    for key, value in masks.items():
      res_masks[key] = np.vstack([res_masks[key], value])
The only bit I change is with visualizing each individual item (what I went for) I did the following:
fig, axs = plt.subplots(1, 3, figsize=(20,20))
for i in range(3):
  axs[i].imshow(np.expand_dims(res_masks[0][i], 0))
As such I get visualizes like so:
I believe this is working properly? Please correct me anywhere or if the attention is off.
And I think that when reading this attention the more yellow a particular value is the more we’re utilizing it on this particular instance? So is it fair to then say that since in my to.x_names (which is my cont and cat names together) we’d say that for image 1, ‘education-num_na’ (the sixth variable) was utilized the most followed by ‘occupation’ and then ‘marital-status’? I think this is right as the original one seemed to just stack the batches up
Edit: Yes I realized this is true. Here is my final outcome:
To get here we have:
@patch
def explain(x:Learner, dl:TabDataLoader):
  "Get explain values for a set of predictions"
  dec_y = []
  x.model.eval()
  for batch_nb, data in enumerate(dl):
    with torch.no_grad():
      out, M_loss, M_explain, masks = x.model(data[0], data[1], True)
    for key, value in masks.items():
      masks[key] = csc_matrix.dot(value.numpy(), matrix)
    if batch_nb == 0:
      res_explain = csc_matrix.dot(M_explain.numpy(),
                                  matrix)
      res_masks = masks
    else:
      res_explain = np.vstack([res_explain,
                              csc_matrix.dot(M_explain.numpy(),
                                              matrix)])
      for key, value in masks.items():
        res_masks[key] = np.vstack([res_masks[key], value])

    dec_y.append(int(learn.loss_func.decodes(out)))
  return dec_y, res_masks, res_explain
and
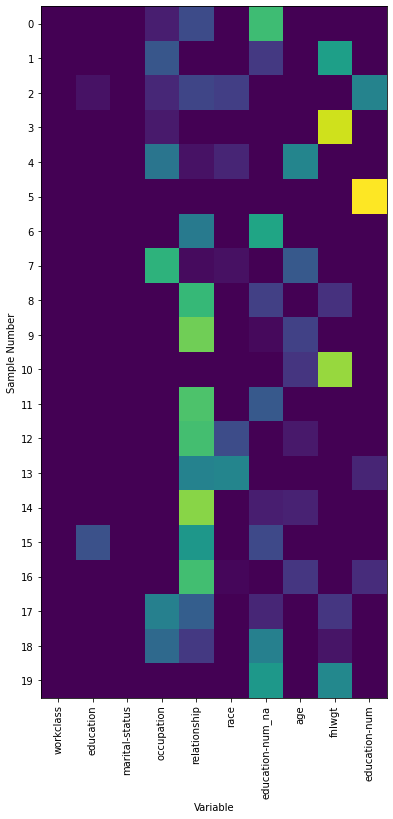
def plot_explain(masks, lbls, figsize=(12,12)):
  "Plots masks with `lbls` (`dls.x_names`)"
  fig = plt.figure(figsize=figsize)
  ax = fig.add_axes([0.1, 0.1, 0.8, 0.8])
  plt.yticks(np.arange(0, len(masks[0]), 1.0))
  plt.xticks(np.arange(0, len(masks[0][0]), 1.0))
  ax.set_xticklabels(lbls, rotation=90)
  plt.ylabel('Sample Number')
  plt.xlabel('Variable')
  plt.imshow(masks[0])
To plot it simply pass in the x_names and your masks:
lbls = dls.x_names
plot_explain(res_masks, lbls)
The full notebook is here
Well @muellerzr, I did not go onto the details of your code but it does seem similar to what the paper says (and what’s implemented in pytorch-tabnet).
Just a quick thought about explainability from the paper which I think got a flaw:
I just wanted to share my thoughts on this (hope it makes sense), but I’d say your explainability looks fine. Just a question, did you implement the global importance as well?
Thank you very much! Glad to know it seems alright for the most part I’ll look into adjusting it pre-ReLU and how that differs
Re: Global no I was not, as we can’t really keep track of the fully yet with our training loop and how it’s set up. What I’d probably have to do is use it as a Callback and so I may go explore that a bit today. Thank you for your feedback!
Wow, that’s a great visualisation of feature importance! If I understand the code, this is a per-batch plot. How do you think, is it practical to do such analysis per row, so you’ll know the rationale of the single prediction?
Changing one little line of code ![]() a test_dl can be one row
a test_dl can be one row
Could you also introduce a bar plot representation (with the mean and std across the batch, something like that). I believe it would be much more readable.
I can’t as my time is limited but you’re more than welcome to
That being said though that’s not the goal of that particular function. The goal is a per input how is it reacting, not an average
The idea is exactly to get “individual explanations” meaning that you can get for each of your prediction a specific explanation of your model’s output.
The overall feature importance is just the mean over all examples of your training set.
I would be interested in knowing how you would measure and compare the model complexity? What would you consider regarding model complexity?
Complexity = # of parameters. The simpler the model the less parameters (and/or) computations required. (which can then translate to speed in some cases)
so in the neural network that would be the number of all weights summed up I guess. That also means that no other changes would change the complexity, for example like a different activation function?
I just thought, that a ReLu might have less complexity than a sigmoid, because it is setting more information to 0…
In this instance I only meant complexity as parameters/computational overhead. (and yes, it would).
ahh ok, thank you