You may want to take a look at a function I’ve built that allows you to see the loss alongside all the metrics you have selected. It’s part of the timeseriesAI repo, but it can be used independently from it.
from fastai2.imports import *
from fastai2.torch_core import *
from fastai2.learner import *

@patch
@delegates(subplots)
def plot_metrics(self: Recorder, nrows=None, ncols=None, figsize=None, **kwargs):
    metrics = np.stack(self.values)
    names = self.metric_names[1:-1]
    n = len(names) - 1
    if nrows is None and ncols is None:
        nrows = int(math.sqrt(n))
        ncols = int(np.ceil(n / nrows))
    elif nrows is None: nrows = int(np.ceil(n / ncols))
    elif ncols is None: ncols = int(np.ceil(n / nrows))
    figsize = figsize or (ncols * 6, nrows * 4)
    fig, axs = subplots(nrows, ncols, figsize=figsize, **kwargs)
    axs = [ax if i < n else ax.set_axis_off() for i, ax in enumerate(axs.flatten())][:n]
    for i, (name, ax) in enumerate(zip(names, [axs[0]] + axs)):
        ax.plot(metrics[:, i], color='#1f77b4' if i == 0 else '#ff7f0e', label='valid' if i > 0 else 'train')
        ax.set_title(name if i > 1 else 'losses')
        ax.legend(loc='best')
    plt.show()
To use it you only need to run:
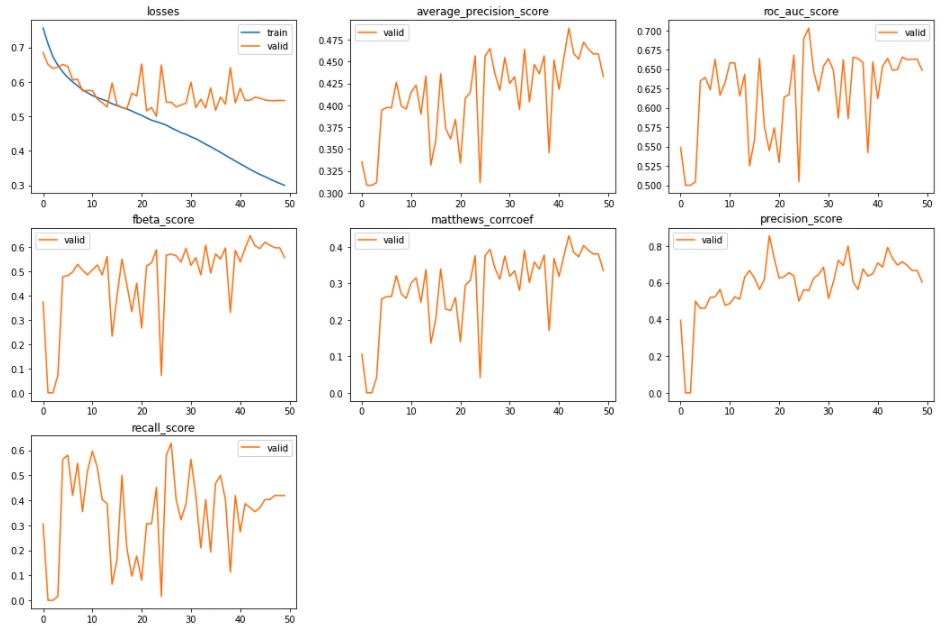
learn.recorder.plot_metrics()
once training has finished, and you may get something like this: