Ah, yes. I was fixated on my application which was not bounding box related, apologies. This thread has been helpful for other problems.
I did this using ObjectItemList -> Bounding box regression using resnet34 in fastai v1
1 Like
Pretty much in the same place. Did you manage to find a solution to this? I understand that the goal is to communicate two things as we create the DataBunch
db_with_coord = (ImageList.from_df(dbox_df, JPEGS_PATH)
               .split_by_rand_pct(valid_pct=0.2)
               .label_from_df(label_cls=FloatList, cols=['b1', 'b2', 'b3', 'b4'])
               .transform(get_transforms(do_flip=1, max_rotate=30, max_lighting=0.1),
                          size=224, tfm_y=True)
               .databunch(bs=16)
     );
- That it’s a regression problem on 4 columns which we’re doing by setting
label_clstoFloatListin the.label_from_dfcall - Ensuring the bounding box co-ordinates are updated with the transformations by adding the
tfm_ytoTruein thetransformcall.
Exception: It's not possible to apply those transforms to your dataset:
 Not implemented: you can't apply transforms to this type of item (FloatItem)
The fact that the error says that this cannot be applied to a FloatItem seems to be because of an incorrect use of ImageList on my part but it seems intuitive considering we’re applying image transformations.
Using a PointsItemList as suggested by some of the comments returns a negative training and validation loss for me.
Didn’t you find the solution to the problem of transforming the bb coordinates?? I’m now exactly stuck at this problem
I think I finally found the solution. I used the technique implemented in head_pose notebook of the course. The idea is to give the model the coordinates of the top left and bottom right points and let it learn! After training, you can obtain the coordinates and have the rectangles as before.
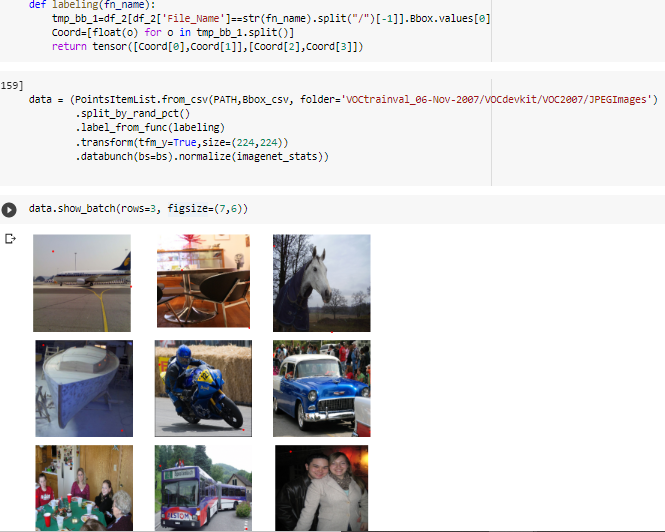
data = (PointsItemList.from_csv(PATH, “tmp/bb.csv”, folder=“JPEGImages”)
.split_by_rand_pct()
.label_from_func(label)
.transform(tfm_y=True, size=(224,224))
.databunch().normalize(imagenet_stats))
This is the API I used and it transforms the coordinate as well when resizing the image.
Let me explain it. in “bb.csv” , the first column is the images name and the second is a string containing 4 coordinates relating to top left and bottom right points of the bounding box.
“label” is a function which receives the file names and obtain the 4 coords by searching a df which maps image ids to coords and returns a tensor containing y,x of the to points (so the shape will be 2 by 2) .
def label(o):
bb = df[df[“fn”] == str(o).split("/")[-1]].bbox.values[0]
coord = [float(i) for i in bb.split()]
return tensor([coord[0], coord[1]], [coord[2], coord[3]])
When you got your data, it is almost straightforward and you make a cnn_learner without needing to use a custom_head.
The model of course returns 4 coords which are in the (-1, 1) scale which converting it to 224 by 224 is simple math.
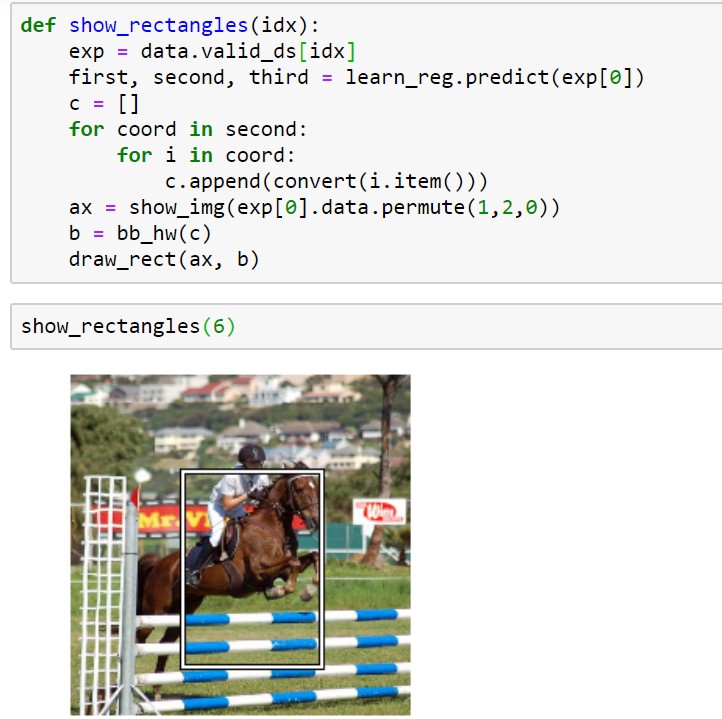
I think it’s doing a great job! Let’s look at an example
BTW, if my explanation is not clear, tell me to clarify.
Hey,
This works pretty awesome. Thanks
If by chance anyone is still implementing L8 of 2018, here is a screenshot of the suggested solution
Happy that it was helpful; it took one whole day from me 
can you please help me understand the exp[0].data.permute(1,2,0)
thats because in PyTorch and fastai the channel dim is the first dimension in an image but matplotlib wants it to be the last one
Thanks for the help.