Thanks for the follow-up! I was scratching my head too and checking if I misunderstood something somewhere (among the incredibly confusing amount of materials about mAP…)
To lay out my current understanding using the dog and sofa example in the image:
For class ‘dog’:
- calc jaccard(all ‘dog’ predictions, all ‘dog’ gt_bboxes)
- for all ‘dog’ predictions where IoU > 0.5 (or a different iou_thres), take the highest IoU box and call that TP (more generally: for n ‘dog’ ground truth objects, count n-highest IoU ‘dog’ predictions as TPs)
- count all other ‘dog’ predictions as FP. If all predictions for the class are <= IoU threshold, then they’re all counted as FPs? This last part I’m not too sure on yet…
Repeat for class ‘sofa’ and any other class of interest.
For mAP more generally, we loop through all classes one at a time. Even if there’s no ground truth objects in a class, we still want to catch all false positive since a prediction could be made for a class outside of ground truth (i.e. a prediction for ‘car’ in our example image would be a FP in ‘car’ class). We also want to catch all false negatives in every class (i.e. if a ‘sofa’ gt object has no predicted boxes, that would be a FN in ‘sofa’ class).
Does that sound right to you?
Btw, I’ve created a P-R curve up for category 14 (‘person’) using a range of model thresholds = np.linspace(.05, 0.95, 40, endpoint=True) which I believe is the same as your nb.
Shape looks pretty similar despite the difference of TP/FP/FN counting. I guess because across the whole image set, it’s not a significant difference in the P or R calcs:
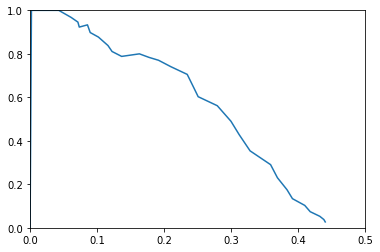
The AP of cat 14 in this P-R curve (using your avg_prec func) comes out to be 0.286.