How does treeinterpreter's method compare to shapely values?
3 Likes
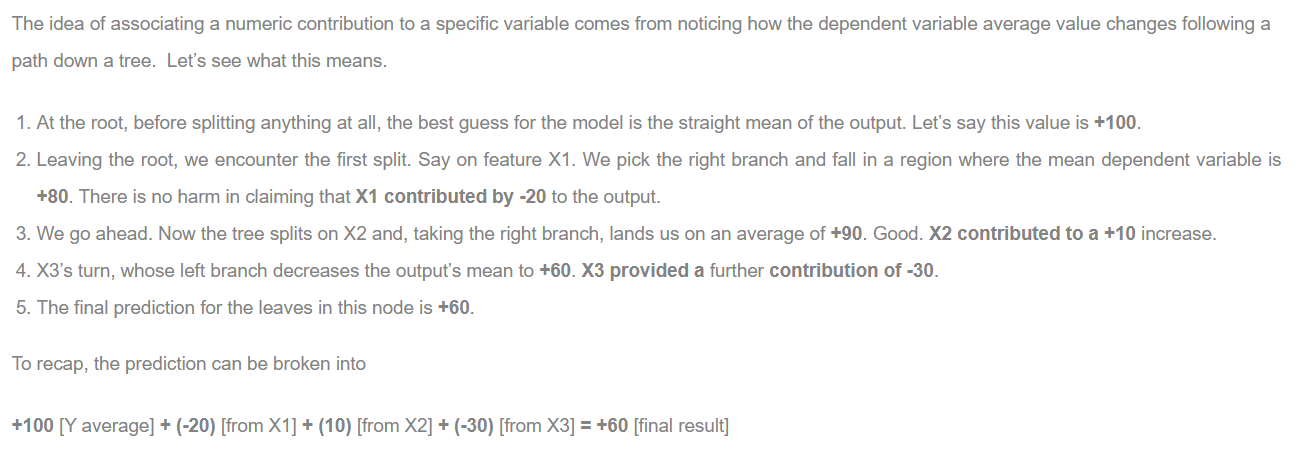
How are the contributions calculated in the tree interpreter? Just to understand it at a higher level…
Look here
2 Likes
Jeremy said this question would be better for the advanced thread.
1 Like
2 Likes
Question for Jeremy from Larry D. of the TWiML study group:
How do the feature importance values relate to correlation?
2 Likes
The end result is more or less the same, at least in terms of interpretation.
They come from 2 completely different approaches though.
treeintepreter just looks at relative differences of the metric of interest across splits, from the root to the leaf.
Shapley values come from game theory. They have a strong theoretical background (and I prefer them), compared to what treeintepreter spits out.
4 Likes
BTW this approach of trying to determine if the data is training or validation data is known as adversarial validation and is often done at the beginning of Kaggle competitions to also check if the test data is of similar data distribution as the training/validation data.
5 Likes
Question from Jiwon of the TWiML Study group:
Why don’t we use y_range from -0.5~5.5?
1 Like
what about replacing sale id and machine id with non-ordered ids?
(in contrast to removing them to fix the problem with time orderings)
could you please point to resources for this? @ilovescience
1 Like
How is this done for image data?
Feature importance accounts various feature interactions in the tree,whereas correlation just considers two variables.
Not certain, but I think that “0” was not actually a choice that users could rate. It seemed to me like it was used as a placeholder for “no rating” in some of Jeremy’s models.
That means that the lowest you would need to predict is “1”, which means that setting range 0 provides sufficient buffer.
Check out some of Bojan Tunguz’s kernels on Kaggle.
Here is an example where he accurately predicted the “shakeup” of a tabular competition using this method:
https://www.kaggle.com/tunguz/lanl-adversarial-validation-shakeup-is-coming
7 Likes
If 2 features are highly correlated their relative feature importance would be reduced compared to keeping just one of the two.
Here why.
A random forest selects features randomly at each split (in general).
If 2 variables are correlated, they more or less carry the same signal wrt the dependent variable.
Hence you can expect a tree to split on either of the 2 evenly.
As an end result, your 2 features will have much less importance, just because they are carrying the same information. They hide each other.
I generally remove correlated features even if it is not strictly needed, just to be able to uncover these kind of hidden relationships and spot truly important variables.
2 Likes
You would just train on the images directly. Here’s an example:
https://www.kaggle.com/konradb/adversarial-validation-quick-fast-ai-approach
3 Likes
Same way as Jeremy is doing for tabular.
Just create a dataset with a new dependent variable (valid VS train) and train a model on that.
If your model is good, you are in trouble 
1 Like
So dropping features in a model is a way to reduce the complexity of the model and thus reduce overfitting? Is this better than adding some regularization like weight decay to tabular models?
2 Likes
Is there a good heuristic for picking the number of linear layers in the tabular model?
1 Like