Model prediction for a user = sigmoid_range(dot (multiply) product of the embeddings vector (one of the value in user_weight * all the weights of item_weight) + user bias + item bias, *self.y_range)
Referring to the output of learn.model in the 08_collab.ipynb, I am putting it in the matrix multiplication form:
sigmoid_range( matrix(1,50) * matrix(1635, 50) + matrix(944,1) + matrix(1635,1), *self.y_range)
This looks good, however for the user bias you’ll only want to use the bias for your specific user, so it’s just a single value you are adding.
For the multiplication of the weight vectors you could either use elementwise multiplication and take the sum: (matrix(1,50) * matrix(1635, 50)).sum(dim=1)
or just matrix multiply them, making sure the dimensions match: matrix(1,50) @ matrix(1635, 50).t()
which makes the second matrix of shape (50, 1635).
I hope this helped, just play around with it, it took me a while to get a feel for the vector and matrix stuff
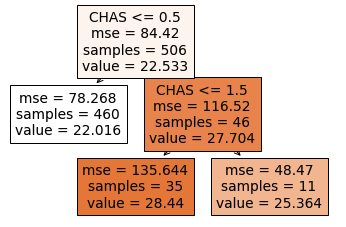
When I fit a decision tree on one categorical feature and run scikit-learn’s plot_tree, I get a tree diagram that shows splitting using <= rather than equality, which seems to contradict this bit of 09_tabular.ipynb:
Try splitting the data into two groups, based on whether they are greater than or less than that value (or if it is a categorical variable, based on whether they are equal to or not equal to that level of that categorical variable).
Is the passage wrong, or am I misunderstanding something?
Here’s my code:
import matplotlib.pyplot as plt
import pandas as pd
import sklearn.datasets
from sklearn.tree import DecisionTreeRegressor, plot_tree

boston = sklearn.datasets.load_boston()

X = pd.DataFrame(data=boston['data'], columns=boston['feature_names'])
X.loc[:10, "CHAS"] = 2  # adding a third level for generality
X = pd.DataFrame(pd.Categorical(X.loc[:, "CHAS"]))
y = boston['target']

dtr = DecisionTreeRegressor(max_depth=3)
dtr.fit(X, y)

plot_tree(dtr, feature_names=["CHAS"], filled=True)
Looking at the source code, it defines every column of type “float” as continuous. Integer columns depend on the cardinality, if max_card is set to 1, then every integer column is treated as continuous as well. Every other column is categorical.
Im running into an error i can’t seem to fix. any help will be appreciated.
[Errno 2] No such file or directory: '/root/.fastai/archive/bluebook'
Even though I am following the exact steps as the notebook, I keep on getting this error when I run this code:
if not path.exists():

    path.mkdir()

    api.competition_download_cli('bluebook-for-bulldozers', path=path)

    file_extract(path/'bluebook-for-bulldozers.zip')

path.ls(file_type='text')
Its a late reply but if you have not figured this out and for others -
If you go into the hierarchy.py file and change:
if labels and Z.shape[0] + 1 != len(labels):
to:
if (labels is not None) and (Z.shape[0] + 1 != len(labels)):
Hello, in chapter 9 lesson 7, i have a question. What exactly does FillMissing do? I ask because i am given to understand that it fills missing values with median of the column, but in the picture i attached we still addressed missing value (despite using FillMissing earlier):
Very helpful reply. Just trying the last two days different things. I understood there is a problem regarding labels because without labels it was plotting, Although labels are just numbers. However, never imagined one should change the actual scipy function. Thank you very much
I agree that max_card of 1 is weird, and it took me a while to figure out what was going on: setting max_card to 1 I got 51 categorical variables, setting it to 9000 I got 60 categorical variables. I then started investigating some of the 51 I got in the first case and I found out that they all had > 1 category.
If you look at the source code for the cont_cat_split(...) function (e.g. here), you see where the trick is: a variable is considered continuous if it has integer values and > max_card occurrences or if it has float values. In the case of the 51 categorical variables, they are all string-valued!
I’m having trouble understanding the answer to this question in the workbook 08 questionnaire:
Why do we need Embedding if we could use one-hot encoded vectors for the same thing?
Embedding is computationally more efficient. The multiplication with one-hot encoded vectors is equivalent to indexing into the embedding matrix, and the Embedding layer does this. However, the gradient is calculated such that it is equivalent to the multiplication with the one-hot encoded vectors.
I understand the first 2 sentences, though I really don’t understand the “gradient is equivalent part.” Can someone share a concrete example of calculating the gradient of the multiplication of the one hot encoded vectors? How can multiplication have any sort of gradient?
Lastly, how does the Embedding class know about the gradient when all it’s doing is basically indexing in?