By checking your model results with your test data. Multiple error measures like MSE, RMSE, etc can be used.
By checking the outputs of your model results on your test data. Various error measures like MSE (Mean Squared Error), RMSE (Root Mean Squared Error), MAE (Mean Absolute Error), etc can be used.
thank you 
Hi, SQL queries also depend on indexeses and their structure so you can include it as tabular data old fashion way would be to use QUERY analyzer also in most cases parametriezed queries qre prrecomipilled and optymized good luck 
have you got the fix?
In the part where Excel solver is used for collaborative filtering, how does the gradient descent ( excel’s solver) work on the data cells for which there are no existing values , for ex user-id, movie-id : 293,49
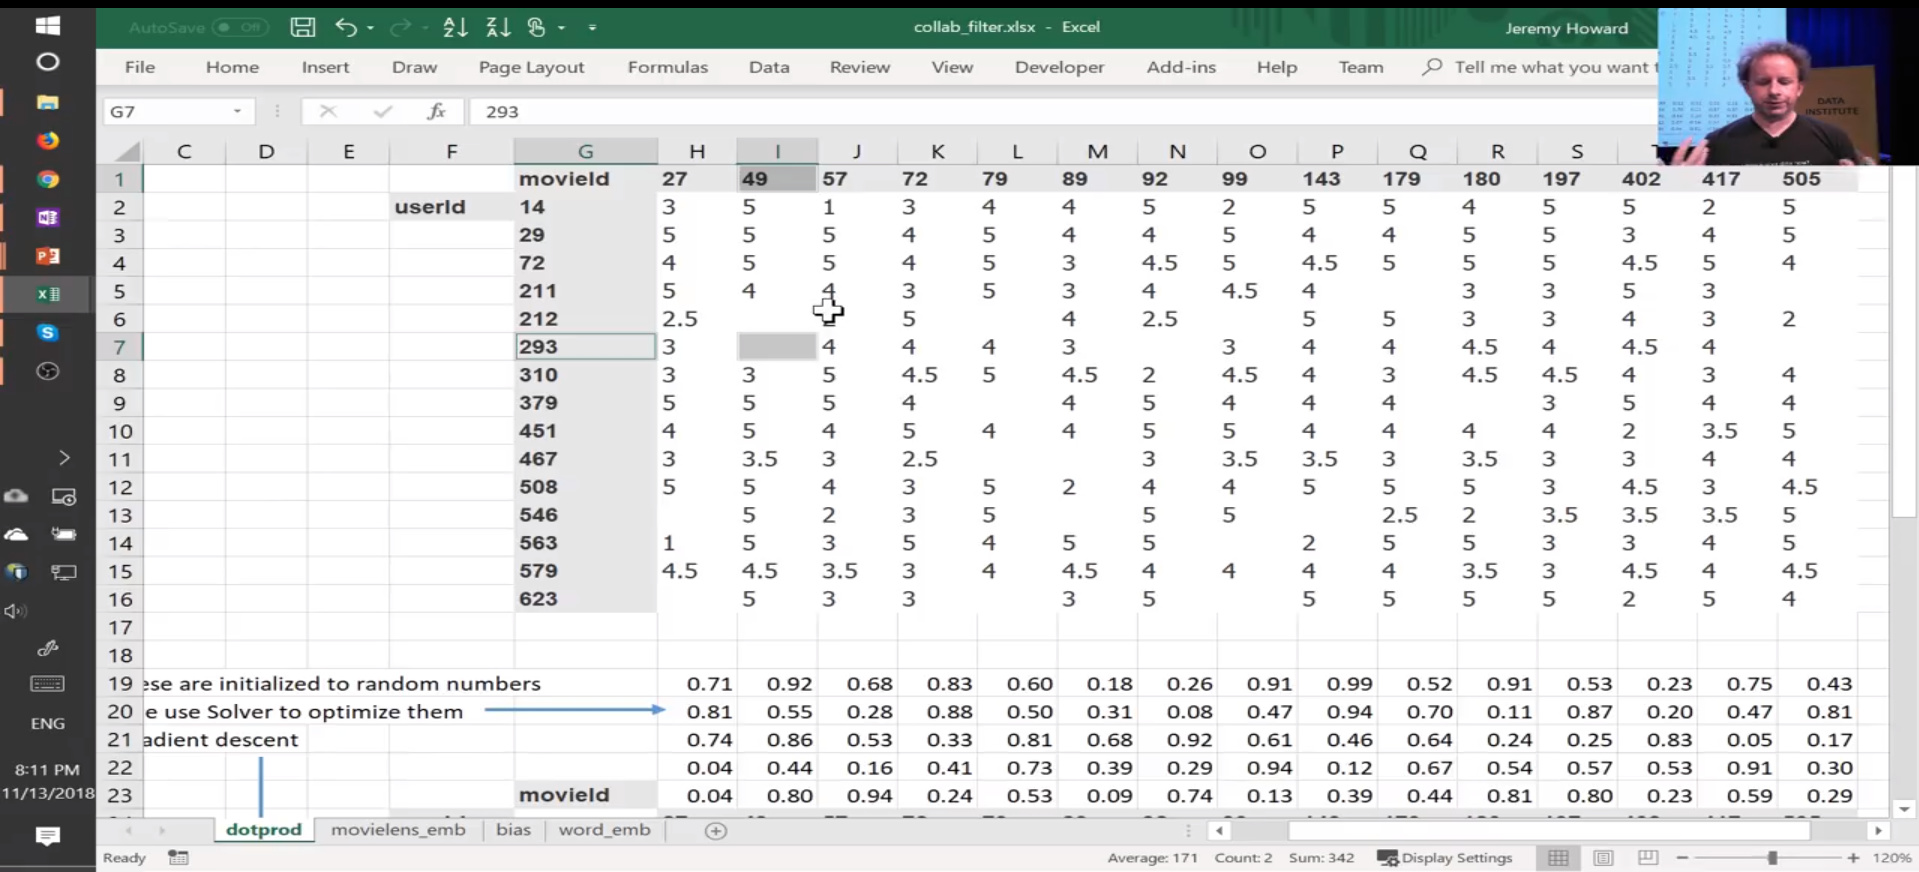
Hey @mayanksatnalika - to understand the math behind gradient descent in Excel’s solver, check out this Excel model I built (you can download and edit the Excel version (recommended) or view the Google Sheets version (calcs work VERY slow online)).
Rather than rely on Solver, I wrote out all the formulas. Here’s a blog post I wrote about it that explains the step-by-step math and collaborative filtering in general:
Versus Jeremy’s file, here are the key differences:
1. Gradient descent done using formulas (not Solver, no macros) - Used step-by-step formulas (full derivations…) in batch gradient descent so you can see the math.
2. Added hyperparameter inputs as drop-downs - You can play around with the learning rate, L2 regularization penalty, initial weights, etc…to understand the impact on your errors.
3. Split data into training vs. test sets - This allows you to see the importance of regularization vs. overfitting
4. Added L2 regularization penalty - Helps the model generalize better on the test data
5. Added latent factor visualization graph in Excel
1 Like
Wow, this was a beautiful and informative article, however I’m still not clear on my question, assume your case, where you took 30 fictitious ratings (5 users x 6 movies) that is all 5 users had rated all 6 movies, now assuming a case where ay user 3 rated only 5 of the movies and user 5 rated only 4 of the above movies, how would I train a model in this case?
I’m thinking something along the lines of using 0 or the average of the rating of that movie across all other movies.
I may be completely wrong here, but I think this is more of a choice of using the language, since you used Excel to manually derive the gradients and do the calculations, you can manually ignore Titanic for Tina, I’m trying to implement this with PyTorch (don’t want to implement the deriviatives calculation and gradient descent) and so will have to use something to fill the values in the data.
In short, if a user hasn’t rated a movie, it gets ignored during both gradient descent (as your model learns the user/movie latent factors) and is ignored in the RMSE loss calculation.
In python, the gradient descent calculations would need some sort of “count” of “movies rated in training data” (if updating an individual user bias) or a “count” of “number of users rated” if updating a movie bias. See Excel screenshot at bottom to see how I handled this in Excel. The counts are used in each training iteration when calculating “AVERAGE” gradients.
You shouldn’t need to fill in any “no ratings” with anything (like the average from other movies/users, etc.).
Excel model explanation:
To see how the math treats user-movie combos with “no rating” - download and view the Excel model (Google Drive link) which uses the 15x15 matrix (actual movie lens data from Fast.AI lesson).
(Sorry, I didn’t realize my 5x6 “toy model” didn’t have any examples of “no ratings”.)
For instance, Sheree has not rated “Shawshank Redemption” (great movie, we’ll forgive her…). On sheet “summary,” this gets ignore during the RMSE calc.
In the squared error calcs (see cell N3), the training error ignores anything with “no rating” OR “test data.”

During training, this is also ignored in each iteration of gradient descent. Since “Category” (column H) = “No rating,” the “actual” (column I) says “ignore.” In each of the gradient descent calcs, if the model sees “ignore,” it returns 0.00 and it does not get counted when calculating our average gradients.
Screenshot of training - shows calc for updating user feature 1:

2 Likes
access denied… 
In pytorch, would a loss function like below work: ?
def my_loss_func(y_hat, y):
   cnt = 0
   for idx, val in enumerate(y):
         if val != -1 :
           s = s + val  - y_hat[idx]
           cnt  = cnt + 1
   return s/cnt
Basically I want to take into account losses for only those values where the real answer is not equal to -1 (a value I fill the unrated values with).
If not, any ideas on the correct way to approach this? cc: @OCData_nerd any insights on how to do this in Pytorch?
Hi,
Can anyone please help me to understand how we can define the values of layers? Is this a hyper-parameter?
learn = tabular_learner(data, layers=[500,10], metrics=accuracy)
Thanks
Amit
Has anyone on the forum done any work involving the combination of media (image/text) data with tabular-style meta data, which Jeremy answers a question about @ 49:10?
1 Like
What is the way to train a base Language model like the Wikitext one from scratch using fastai or PyTorch?
Hi
Note in lesson4-collab
data = CollabDataBunch.from_df(rating_movie, seed=42, valid_pct=0.1, item_name=title) correspond
to an old version of fastai ?
you must suppress valid_pct args !
How to PR this on github ?
Regards
Bruno
Fer People like me that want to understand the linear algebra stuff with matrices and dot products a bit, there is a wonderful youtube series by 3Blue1Brown:
Matrix Multiplicaton: https://youtu.be/XkY2DOUCWMU
With uneven dimensions in the matrices: https://youtu.be/v8VSDg_WQlA?list=PLZHQObOWTQDPD3MizzM2xVFitgF8hE_ab
Dot Product: https://www.youtube.com/watch?v=LyGKycYT2v0&index=9&list=PLZHQObOWTQDPD3MizzM2xVFitgF8hE_ab
1 Like
The third value: tensor([[9.9999e-01, 1.19991e-05]]) is the predicted probabilities for the individual classes ‘pos’ and ‘neg’.
Hello, I have a question, in the lesson 4, the wiki pre-trained model is used to classify if a comment is positive or negative, how can I use this model to answer questions ? meaning that there are no positive/negative labels, instead, the output will be string answers.
Now I have training data that contains questions and corresponding answers, for example, question:“what is the role Chris Evans plays in movie the Avengers?”, the answer is “Captain America”. how can I put such training data into the pre-trained model rather than a dataset with positive/negative labels ?
Thank you .
I think there is no way that a language model can come up with the answer of “Captain America” from the question that these two words don’t even show up. Because the purpose of a language model is to learn the meaning of words.
However, you may want to learn about ‘Knowledge Map’ for this kind of problems.
Hi there, I have a quick question about the tabular example. More in particular, about this notebook: lesson4-tabular.ipynb
Is there any way of having 2 dependent variables? Let’s say I want to predict the salary and the ocupation together from the data (and not just the salary). What would be the best way of approaching this?
Thanks!