*SOLVED
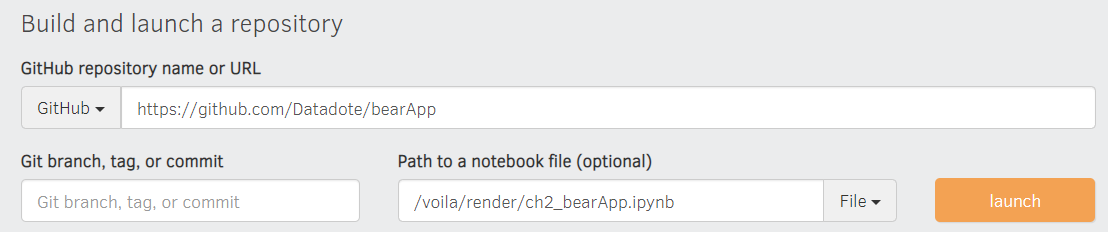
I think I was wrong on the “master” in URL path suggestion. I did not have a “requirements.txt” file in the course-v4 repo. The requirements.txt is needed to tell binder what packages to install. 1) You can’t have “master” in your the github URL path, otherwise binder gives you a can’t resolve URL error. If you forked the course-v4 repo, you can’t use binder for this because the repo has “master” in the URL 2) Make a new repo (without master in URL)
Make a new repo for simplicity
Add your bearClassifier.ipynb, export.pkl, and requirements.txt
Double check all the file were uploaded correctly. For example, make sure the mybinder export.pkl size roughly matches your github repo file size.
I followed the instructions with pasting the github repo, and then the /voila/render/name.ipynb, but it seems like binder can’t find the github repo link. Is there a caveat about the github repo url? I forked it from the course-v4 master.
A previous version of this course used Google Search for gathering images instead of the paid (after a short trial) Bing option here. Why the change? And is the equivalent code for doing it for free via Google still working and available?
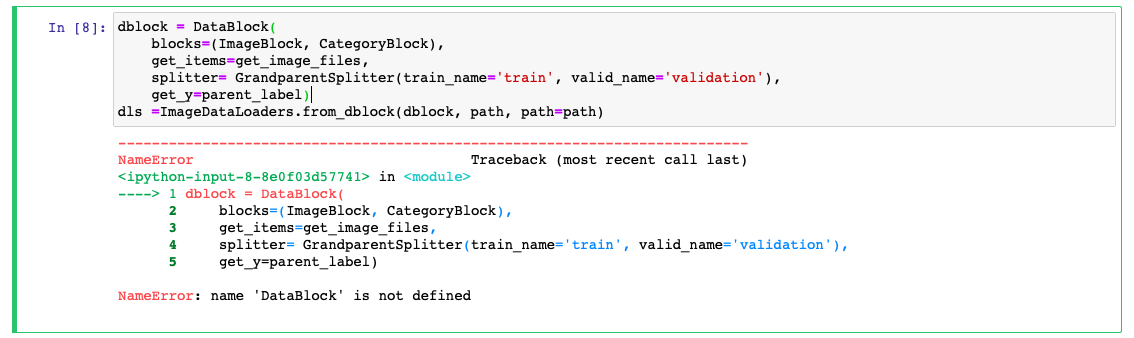
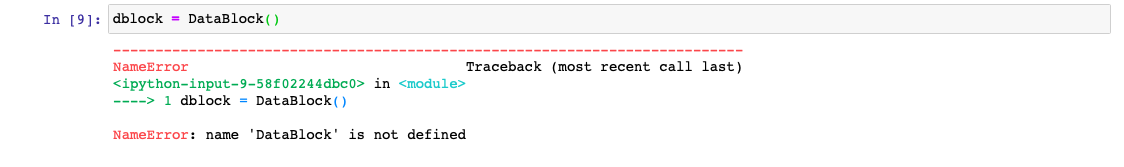
Sorry I don’t know what that might be, something in your dataset is different than what I tried, most likely.
As a starting point I’d suggest you check that get_image_files returns what you’d expect, then that the GrandparentSplitter correctly splits it into train and valid and then debug from there.
Is there a regression/float block or similar which can be used with the DataBlock API, to perform regression to predict a pets age, in the way Jeremy described in the lesson?
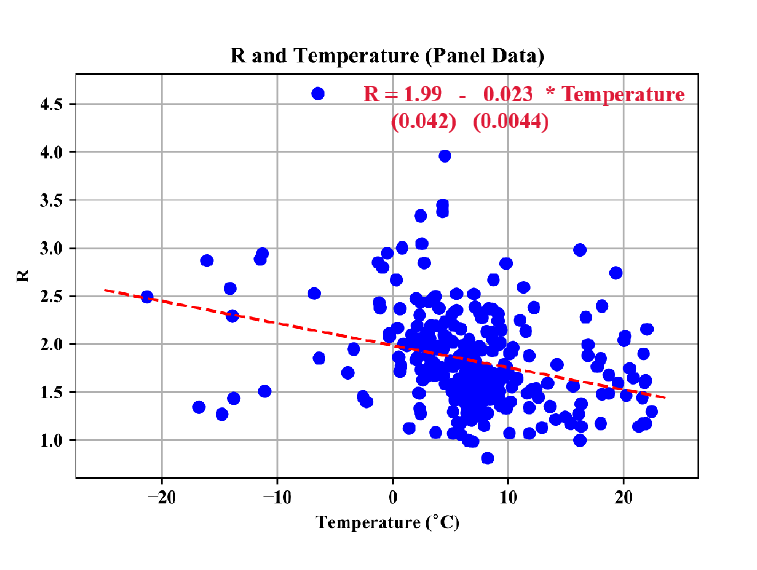
Hi, in lesson-2 Jeremy mentions about the paper on temperature and humidity. In that paper, he shows a plot between R and temperature. How did he get the data for R( how well the virus spreads)? Are the calculated by some means in relation with the number of cases or are they just raw data available elsewhere?
Hey kofi, I figured it out. Check out my bear classifier post in this thread. Not sure how to link it here. My guess is you might have “master” in your url.
You need to git pull🙂
“rows” has become “nrows”.
Gentle reminder to do a quick search on the forum first (I know we sometimes forget including me too )
Yes, I did that in the beginning of the notebook. I also tried restarting the kernel and re-running everything, but nothing seems to be working. I am going to shut down my paperspace notebook and try it again.
In your cells change all “rows” to “nrows” to get it working. Git pull is another option as others have mentioned to get the latest version of the notebook.
Hello everyone I have several beginner type questions regarding chapter 2 and data resize:
As I’m building my first model using the lesson 2 from the book I realized there are multiple examples for different resizing functions.
1st question: As part of data clean up is it considered a good practice to use a particular resizing (Crop vs Squish or other)? I was going over the code and doing some clean up in my notebook and I realized the first time we create the datablock the init method does not contain the data augmentation and is resizing using the default but when we are about to create the model we are resizing using random crop and also passing augmentation.
2nd question: if I follow the code does that mean it first resizes images the 124 then to 224 and performs the additional functions to the already resized 124 data or does it load the original data set and performs 224?
3rd and last Is there any benefit on performing 2 resizes or should we stick to do the resize and transformations only once?
I’ve checked and my model is now at .1 error rate I’ll clean up and re create using only 1 resize and report back if I see any changes but it would be good to understand if there is a good rule of thumb or best practice.
 )
)
 Is there any benefit on performing 2 resizes or should we stick to do the resize and transformations only once?