The tyre image classification results are depicted below in the image and it is poor as compared to the bears classification.
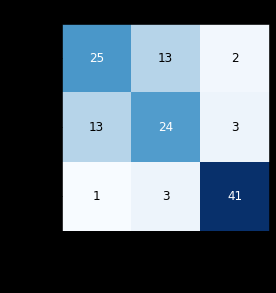
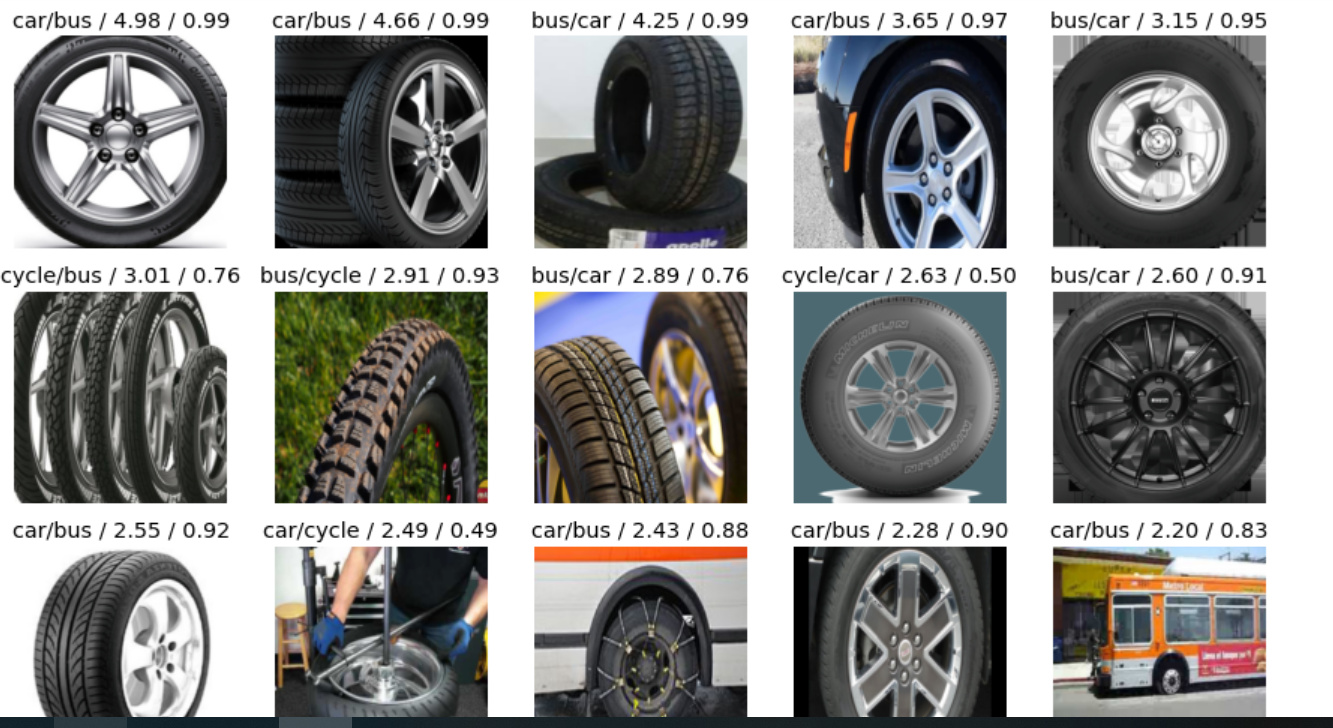
I execute the plot top losses command and it seems to be an issue with the images that were retrieved from bing i.e. labeling issues. It seems the bus folder has images of car tyre or cycle has images of car. The model is predicting correctly whereas the labeling is the root cause of the lower accuracy.
interp.plot_top_losses(20, nrows = 4)
Is my understand right? How can the images be pulled such that it is easier to verify (manually verifying 150 images is a tall ask) and also that it is a JPG?
Regards
Ganesh Bhat