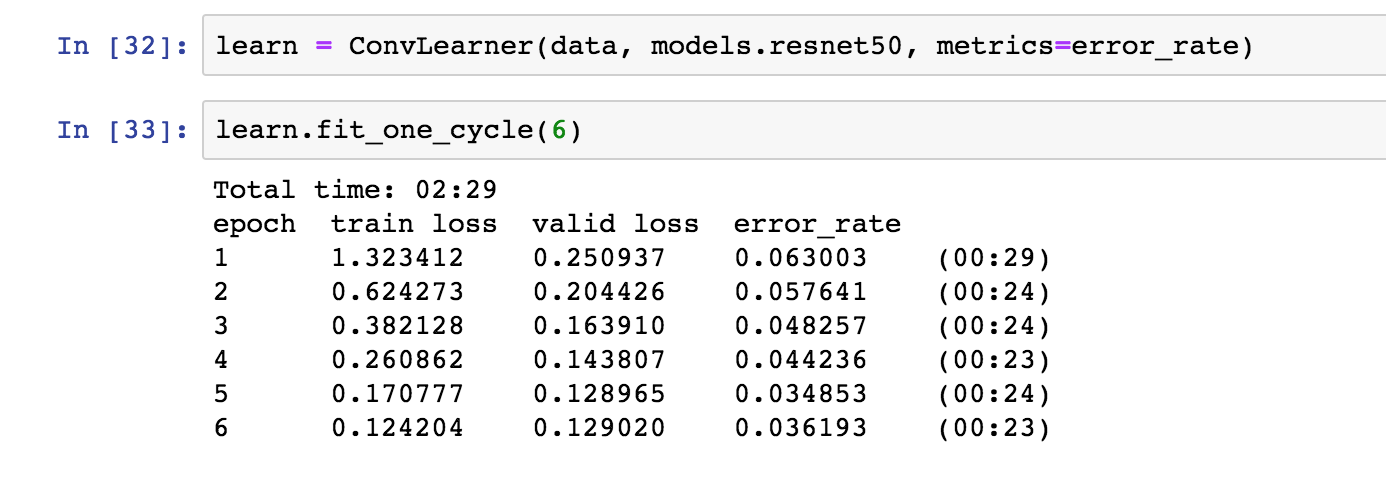
Got to 3% in 6 epochs simply by using Resnet50 ![]()
1 Like
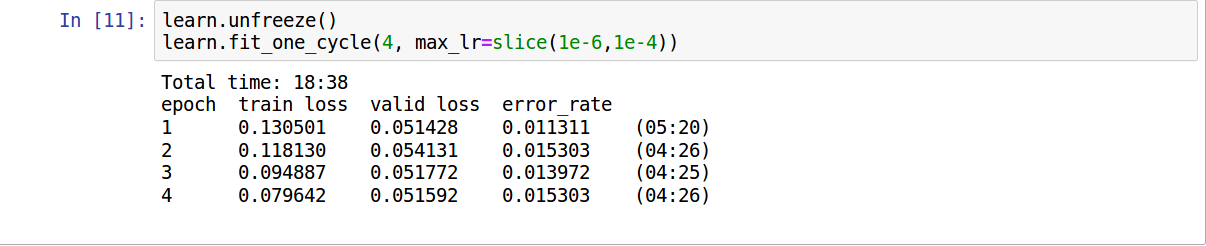
Rounding down by 20% now, are we?.. ![]()
4 Likes
Google Colab
Os: Ubuntu 18.04 Bionic Beaver
Cpu: 2x vCPU, Xeon E5
Ram: 12g
Gpu: Tesla K80, 12g
resnet34:
learn.fit_one_cycle(4): 6min 56s
unfreeze, learn.fit_one_cycle(1): 1min 50s
unfreeze, learn.fit_one_cycle(2, max_lr=slice(1e-6,1e-4)): 3min 41s
resnet50:
learn.fit_one_cycle(5): 16min 48s
unfreeze, learn.fit_one_cycle(1, max_lr=slice(1e-6,1e-4)): 4min 18s
1 Like
I am quite surprised that pytorch still shows compatibility with kepler (K80). I have a Maxwell card, and it complains that it is no longer supported.
Since the K80 is a datacenter gpu, I would guess that it, and drivers for it, has long term enterprise support.
1 Like
On the Fine-tuning Step I got around 1.11 to 1.53 % error rate using the resnet-50.
Os: Ubuntu 18.04 Bionic Beaver
Cpu: 8x vCPU, Xeon E5
Ram: 12g
Gpu: Tesla K80, 12g
1 Like
That’s astonishingly low! Can you share your notebook so we can see how you did it? If you re-run, do you get the same result?
2 Likes
Yes I’m quite interested too. ![]()
Something is wrong. I get 01:11 with a 1080ti, 18.04, and 970 pro.
It seems no one benchmarked a 1070 yet. My 1070 does it in 01:50, if someone is interested.
I didn’t realize that’s much lower than everyone else, I didn’t do it much else, just the lr_find concept from the previous course.
- fit_one_cycle with the freezing layers for 1 epoch,
- Ran the
learn.lr_find(), found more or lesslr=5e-6as optimal - Unfreeze the layers, ran it for 8 epochs with fixed lr above and a somewhat higher wd
learn.fit(lr=5e-6, wd=5e-4) - ran it the fit_one_cycle with the
use_clroption given in the lecture for 4 more epochs and found these results.
I think it was a lucky guess or just random chance, let me ran it again from scratch to check and get back to you.
5 Likes
Awesome results! Curious did you change the value for the seed np.random.seed(2)?
Or did you define your own train/val split?
No. I didn’t change it at all.
I’m trying to replicate the results but now I’m having a Jupyter Issue in Google Cloud. It’s simply not saving the results whatsoever. I’ll ask in a separate thread.
I was able to replicate the results from scratch more consistently without even running the fine-tuning steps. The fine-tuning gave marginal gains, however. The only difference is I’ve chosen the p100 this time on GCP to run faster, the remaining code is exactly as in the lecture. I’m running the fastai v1 image at GCP by the way.
learn.fit_one_cycle(8)
Total time: 07:56
epoch  train_loss  valid_loss  error_rate
1      0.186338    0.235053    0.078510    (00:58)
2      0.243913    0.452330    0.134398    (00:59)
3      0.334885    0.509351    0.145709    (01:00)
4      0.271754    0.405032    0.119095    (00:59)
5      0.177702    0.269540    0.081836    (01:00)
6      0.101564    0.217598    0.063207    (00:59)
7      0.055242    0.181351    0.052562    (00:59)
8      0.030207    0.178198    0.051231    (00:59)
My lr_find gave me different optimal results this time ( ~5e-3 ), but I’ve disregarded and used the same lr from last time and a lower wd:
learn.unfreeze()
learn.fit(8, lr=5e-6, wd=1e-7)
Total time: 09:05
epoch  train_loss  valid_loss  error_rate
1      0.071433    0.046840    0.013184    (01:15)
2      0.064065    0.045984    0.012525    (01:06)
3      0.052138    0.044319    0.013184    (01:07)
4      0.055035    0.043035    0.011206    (01:06)
5      0.049937    0.041700    0.011866    (01:07)
6      0.045954    0.041248    0.011866    (01:07)
7      0.036098    0.040903    0.012525    (01:07)
8      0.034883    0.041864    0.012525    (01:07)
In the Fine-tuning step I the best error rate was 1.05%
learn.unfreeze()
learn.fit_one_cycle(8, max_lr=slice(1e-6,1e-4))
Total time: 08:55
epoch  train_loss  valid_loss  error_rate
1      0.037475    0.042620    0.012525    (01:06)
2      0.036556    0.042057    0.012525    (01:06)
3      0.029351    0.044504    0.011206    (01:07)
4      0.027724    0.042920    0.013184    (01:07)
5      0.026063    0.040404    0.010547    (01:07)
6      0.023599    0.040851    0.011866    (01:06)
7      0.018255    0.042956    0.011866    (01:07)
8      0.019807    0.043142    0.011866    (01:06)
The Confusion Matrix is beautiful:
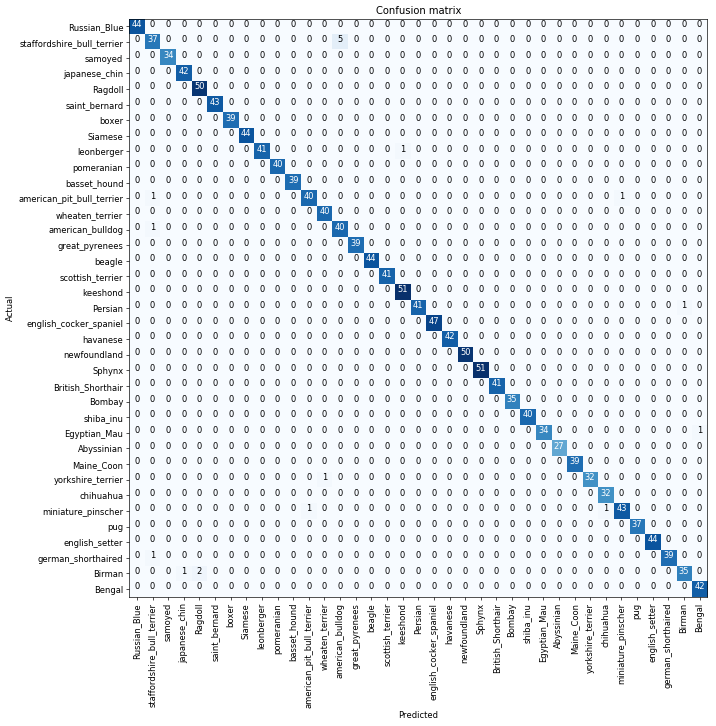
Awesome beginner’s luck in a humble 16 to 24 epochs. I wish I could be that lucky at Kaggle.
Notebook here Notebook Lesson 1
12 Likes
Well you totally crushed me, that’s for sure! And everyone else ![]() The main differences I see are:
The main differences I see are:
- Reducing weight decay (I wasn’t planning to introduce this until lesson 6, so now you’ve blown up those plans
 )
) - Not using slice(lr1,lr2) in fine tuning
You could try splitting those two out to see which one is actually making the difference. Pretty sure it’ll be wd. You may even get better results with slice()!
7 Likes
Yes, I cheated a little with wd, not using slice in the unfrozen step at first was just an initial attempt to use the optimal lr found by lr_find as a first step before the unfrozen fit_one_cycle as a fine-tuning step, it ended up great, but I had not much idea at what I was doing, just experimentation.
Nice job. Looking at your notebook, the one other change I found was using size 320 vs 299, but that didn’t seem to affect my results. It seems the big drop in error rate happens in the first epoch of weight decay. I could not replicate that drop in any of my tests.
Some results using this code on my 2080. All are quite overfit by the end so I wouldn’t read too much into small differences in error rate.
|RN|FP|BS|SZ|Time|Error|
|34|16|100|224|4_47|0.053|
|34|32|100|224|5_16|0.055|
|34|32| 48|320|7_29|0.053|
|50|32| 32|320|9_19|0.044|
|50|16| 32|320|8_40|0.043|
|50|16| 32|299|8_07|0.044|
|50|16| 64|299|7_20|0.041|
2 Likes
Hey guys, I have a question about the differences in error_rate.
I know the topic was raised earlier and the difference is often attributed to randomness in shuffling or weights initialization, however I am still bothered by the fact that after running the notebook shared by dear @ronaldokun multiple times, the lowest error_rate I could get is 0.046, while the possible results are 0.015. Too big discrepancy, no?
Could there be any other issues and any way to debug what’s going on, besides accepting the fact of being out of luck?
P.S. platform GCP (GPU - p100)
Hey guys.
That’s very strange, I really ran the notebook again from scratch after discovering that the error rate really was very low and got these results shared.
The only thing that may be different is in the first frozen run,
in a copied notebook of mine it is:
learn.one_cycle_run(8, max_lr=slice(1e-3))
With similar results, I didn’t change anything in the initialization.
I’m trying to replicate now. It would be really helpful if you could try restarting your kernel, then clicking ‘Cell->Run Cells’ to run all from top to bottom. Let us know if you’re able to replicate your result this way. If so, then we should be able to get the same result as you with the same process. ![]()
I’ll do that.