Thanks @cordmaur
Hi @everyone
I hope are doing all well. I am facing a problem with the datatype of the Satellite image which is float32 when I split it is all black and When I try to convert it to an unsigned 8 bit all turns white and my histogram explode. I would like for the mages ot to be black since I am using python for my work and it maximumly accept [0,…,255]. Plz I need help
Thanks
We are happy to announce our new paper showing how to increase Sentinel-2 resolution up to x4
LEARNING SUPER-RESOLUTION FOR SENTINEL-2 IMAGES WITH REAL GROUND TRUTH DATA FROM A REFERENCE SATELLITE
Link: https://www.isprs-ann-photogramm-remote-sens-spatial-inf-sci.net/V-1-2020/9/2020/
3 Likes
What types of features can be engineered from a single lat/long. What tools do people use to do this currently? I am brainstorming an addition to the fastai library similar to add_datepart but for a latlong instead.
Hi Kevin,
i.e. land/water flag or altitude. For specific date there could be inhabited/uninhabited flag or country/district specification as well (depending on datasets used). As an example for tools I use Postgis geo functions and Dbeaver’s spatial resultsets, they are quite handy for managing, transforming and editing spatial data.
Btw, what features have you found so far? 
Tom
1 Like
A few people had ideas on discord that I’m tracking down. There are a few really interesting libraries. One has census information, another has city and country, and another has more international data
All of these libraries were recommended to me by other people. Huge thanks to Cory and Jeremy for sharing those libraries.
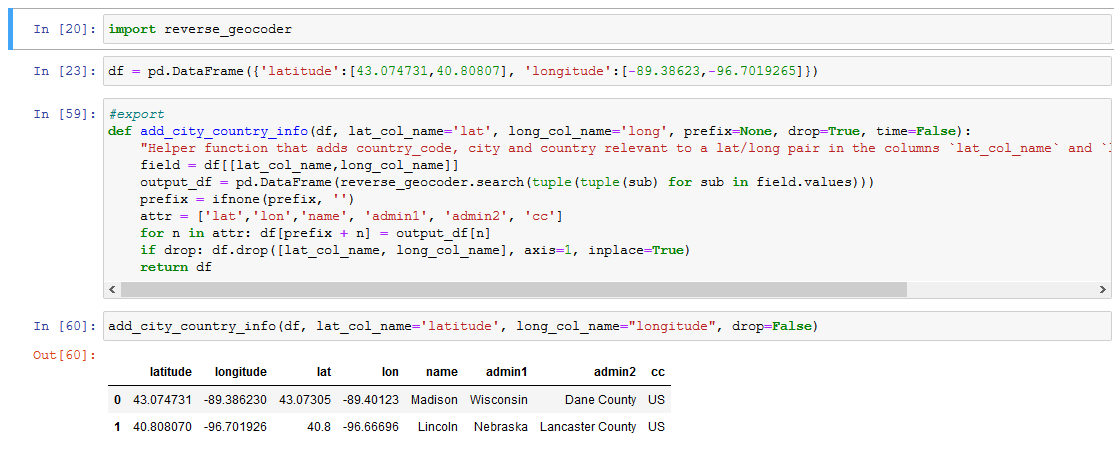
This is what my code looks like so far:
import reverse_geocoder
df = pd.DataFrame({'latitude':[43.074731,40.80807], 'longitude':[-89.38623,-96.7019265]})
#export
def add_city_country_info(df, lat_col_name='lat', long_col_name='long', prefix=None, drop=True, time=False):
    "Helper function that adds country_code, city and country relevant to a lat/long pair in the columns `lat_col_name` and `long_col_name` of `df`."
    field = df[[lat_col_name,long_col_name]]
    output_df = pd.DataFrame(reverse_geocoder.search(tuple(tuple(sub) for sub in field.values)))
    prefix = ifnone(prefix, '')
    attr = ['lat','lon','name', 'admin1', 'admin2', 'cc']
    for n in attr: df[prefix + n] = output_df[n]
    if drop: df.drop([lat_col_name, long_col_name], axis=1, inplace=True)
    return df
add_city_country_info(df, lat_col_name='latitude', long_col_name="longitude", drop=False)
3 Likes
For anyone interested in object detection in aerial imagery the following post is worth a read, covers the origins of the challenge and proposes some strategies to overcome them:
2 Likes
What about connecting to OpenStreetMap, or osmnx(OpenSreetMap networkX). I think there is a ton of people that would benefit from an easy way link your data points to the nearest airport or weather or weather station.
Geocoded public datasets related to climate, water, land and population are available in Earth Engine. They have python API as well.
Spacenet 7: Multi-Temporal Urban Development Challenge has gone live with registration deadline Oct 28 2020. The goal is to track individual building construction over time from Planet imagery. This is a challenge because of the small pixel area of each object, the high object density within images, and the dramatic image-to-image difference compared to frame-to-frame variation in video object tracking.
2 Likes
Does anyone know about licensing for datasets derived from Google Earth?
I created a dataset from annotating images taken from Google Earth (https://www.kaggle.com/towardsentropy/oil-storage-tanks) and I’ve received some inquiries from companies about using the data for commercial applications. I’d like to put the data under an open source license that would allow for any kind of usage, but I don’t want to accidentally infringe on any Google Earth related licenses. I haven’t been able to find much on this, because all the licensing information I can find relates to using Google Earth software as part of a commercial product.
1 Like
See Brand Resource Center | Products and Services - Geo Guidelines which states ’ If you want to use Google Maps, Google Earth, or Street View for other commercial purposes – meaning “for sale or revenue-generating purposes” – please contact the Google Cloud Customer Team.’ I would reasonably expect this includes monetising their imagery. Better to be safe than sorry and check, please report back
1 Like
Hi KarlH Great work!
It would be great if you could get the solution to this issue as few of us have the resources to get entangled with Google.
Cheers mrfabulous1 
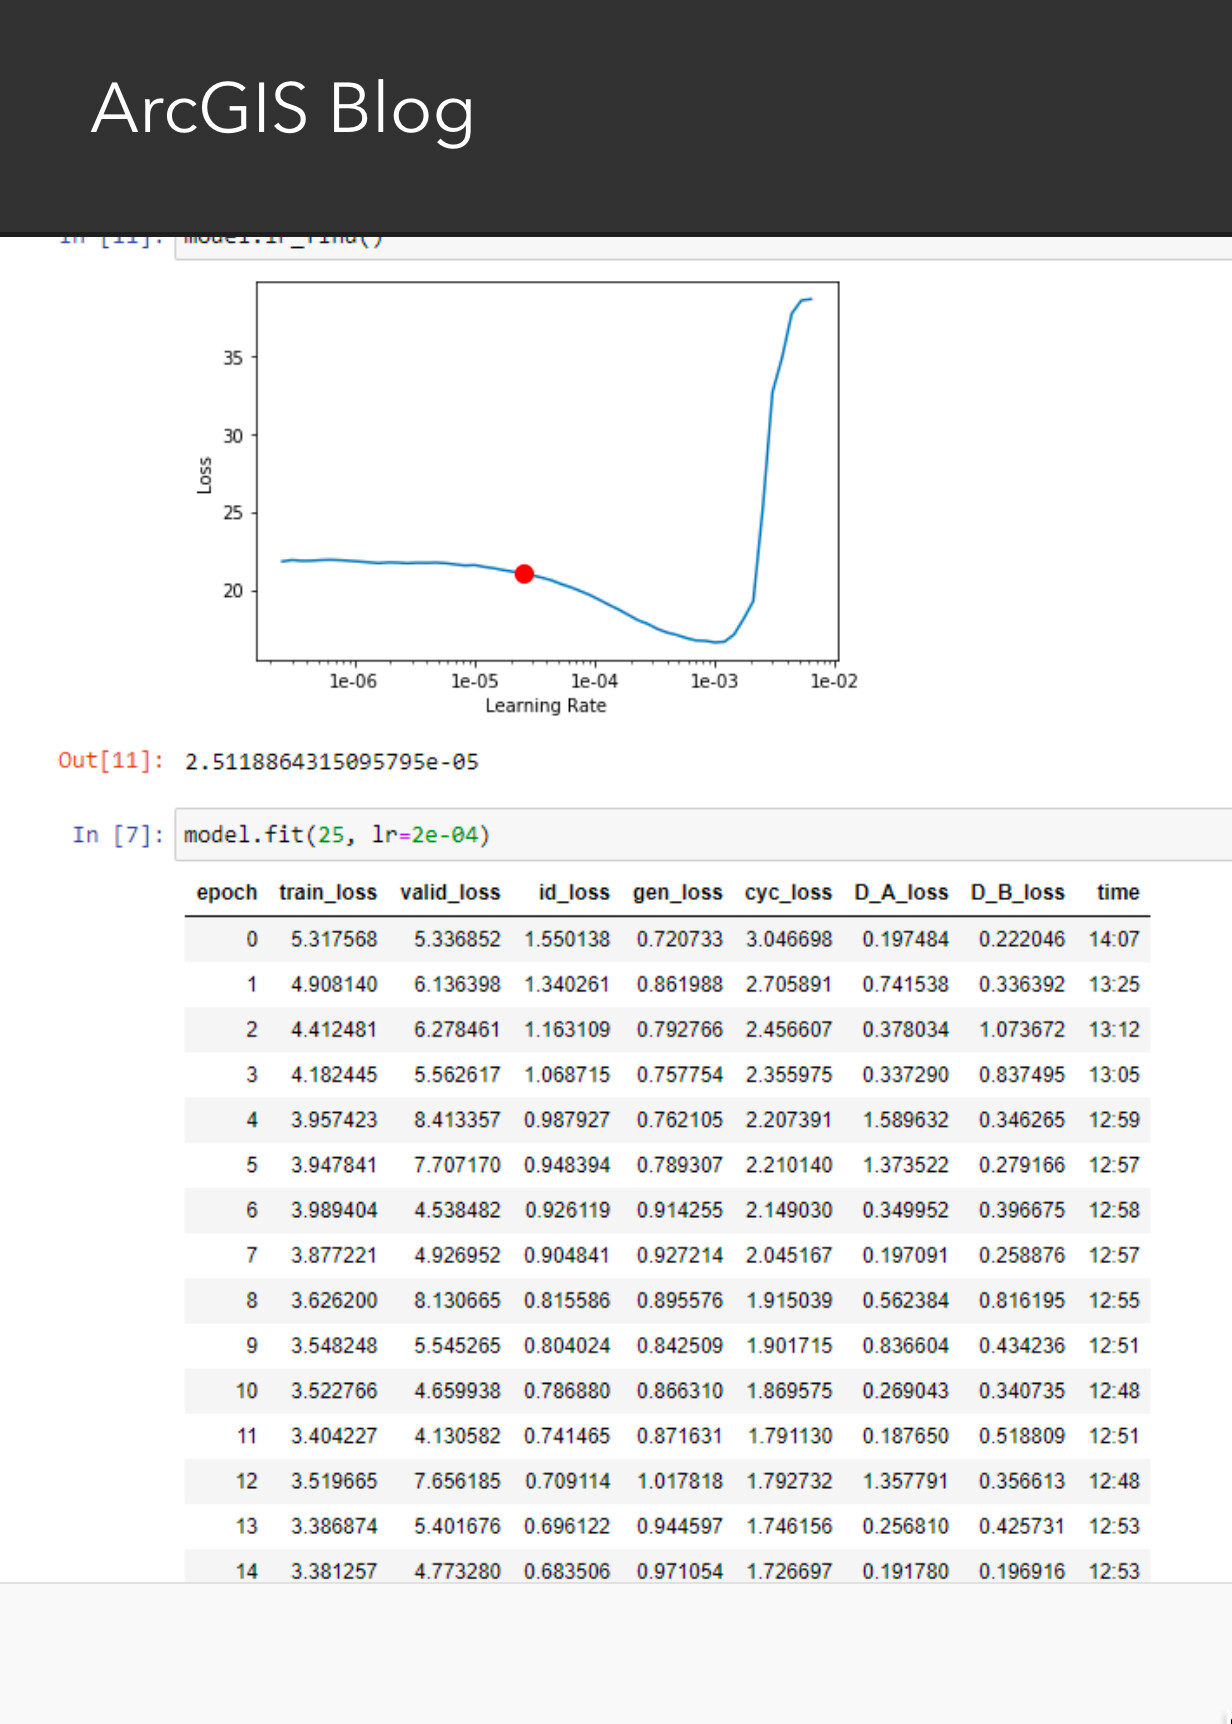
Interesting article on using CycleGan to translate SAR to RGB. It definitely looks like ArcGIS are using fastai…??
1 Like
Not read the article in detail, but yes, ArcGIS API for Python is wrapping fastai!
1 Like
Hi robmarkcole, hiromu_n Hope all is well!
I read the article it definitely looks like they are, these two images of learning are probably the most iconic of the fastai library.
Cheers mrfabulous1
2 Likes
We have succeeded in identify roads and highways using Sentinel-2 imagery (10m) super-resolved using our SENX4 model up to x4 the initial spatial resolution (2.5m) [Geospatial Deep Learning resources & study group]. The results are overwhelming and as soon as possible we will publish a paper. Here is a brief overview: https://tracasa.es/sin-categoria-en/tracasa-succeeds-in-identifying-roads-and-highways-using-images-from-sentinel-satellites-super-resolved-with-artificial-intelligence/
2 Likes
@cayala great work! I assume fastai is used? Be great to see a repo so I can add it to my awesome repo where I have just added a link to your announcement
1 Like
@robmarkcole We started the project using Keras, however we switched to Fast.AI obtaining the same results in much less time. Sadly, it is a private project so the code won’t be opensourced. The aim of this publication is to show there is also possible to achive fine-grained segmentation masks using limited resolution imagery such as Sentinel-2.
2 Likes
Tree species classification with airborne hyperspectral data
I’m delighted to share our article, Tree species classification from airborne hyperspectral and LiDAR data using 3D convolutional neural networks, published in Remote Sensing of Environment. Also, all codes and examples are presented in a related github repository. This was my first first-authored paper, so getting it published in RSE feels pretty great.
Background
This work is a part of IBC-Carbon work package 4 “Improved Earth Observation techniques”. We have worked with the same data using other methods like SVM and RF, and now we tested whether deep learning would improve and turns out it did, at least a bit.
We are especially interested in mapping European aspen, which is a keystone species in boreal forests, and the presence of old, large-diameter aspen can be used as an indicator for species richness and biodiversity. The challenges with aspen is that it has scatterred occurrence, meaning it is difficult to detect it from satellite images, and it is not economically valuable and thus is typically pooled with other broadleaved trees in nationwide forestry inventories. Due to these factors, there is a knowledge gap in aspen occurrence and thus biodiversity status.
Data
The data used in the study contained both around 10p/m² LiDAR data, used for treetop detection and tree crown segmentation, as well as around 470 band hyperspectral data with either 0.5m (VNIR) or 1m (SWIR) ground resolution. SWIR data was resampled to 0.5m resolution with nearest neighbor, and several unusable bands (interpolated due to water absorption, severe abnormalities with the data) were discarded so that final data contained 250 spectral bands ranging from 400nm to around 1800nm.
As the field data, we had field plots from both Natural Resources Institute (LUKE) and Finnish Environment Institute (SYKE), as well as individually measured trees. Unfortunately, data used in our work is not (at least yet) available, as there are several stakeholders that have rights for these data.
Hyperspectral data?
RGB data has three spectral bands, centered in the visible light area of the electromagnetic spectrum (380-750nm). Some satellites (e.g. Sentinel-2, Landsat-8) record multispectral data, which typically has from 4 to 15 spectral bands. For instance, Sentinel-2 records 13 bands ranging from 400nm to 2400nm, with bandwidths ranging from 21 to 185nm.
Hyperspectral data, on the other hand, has very narrow bandwidth and several hundreds of spectral bands. These bands don’t have to extend to NIR or SWIR areas (although they usually do), but the defining trait is narrob bandwidth that enables continuous spectra for the data. Our data had bandwidth of 3.4nm for VNIR and 6.5nm for SWIR. For comparison, Sentinel-2 NIR band (band 8), has bandwidth of 106nm. Our data has 31 bands for this same range.
Due to several different hyperspectral sensors, varying number of spectral bands, different bandwidths and different imaging conditions, there really is no chance to do similar transfer learning as with RGB images and ImageNet pretrained models. There are a couple of benchmark data sets (Indian Pines and Pavia, for example), but because of aforementioned factors they are not suitable for pretraining. Therefore, we trained our models from scratch. 3D CNNs have been identified as the best deep learning method for hyperspectral image classification, so we decided to use those. Other common methods include 2D-CNNs after some dimensionality reduction (PCA or MNF) or hybrid 3D-2D-CNNs, but we settled for the simpler alternative at the beginning.
Workflow
Workflow was approximately the following:
- Preprocess and combine the hyperspectral data
- Use
dalponte2016-function from lidR to detect and segment individual trees from the LiDAR data. There were more than three million. - Match the ground reference data with airborne data by:
- Checking whether a segmented tree crown contained any field data points within it
- If only one, label the corresponding tree crown with that field data point
- If more than one, label the tree crown with the field data point closest to the detected treetop
- As our data contained both field plots and individually measured trees, we priorized individually measured trees in this step, so that only way a tree crown could be labeled with field plot measurement was when no individual trees were located within a segment.
- Extract square patches centered around a treetop from hyperspectral data and split to training and validation sets.
- We tested cubes with 4m, 6m, 8m, and 10m radius (these correspond to 9x9, 13x13, 17x17 and 21x21 pixels spatially)
- Design and train models
- Evaluate
- Produce map for the full area.
Also, use vanilla backpropagation and spatial/spectral occlusion to find out which locations (not really surprising: Treetop area) and spectral bands were the most important for classification (a bit more surprising: SWIR bands in the range of 1550-1750nm). Especially the results for spectral data were a bit unusual, as typically NIR-bands (around 700nm) are considered to be the most important for vegetation classification.
What’s next?
There are actually two separate steps that should be done. First of all, we have some amount of very high resolution drone data from the same area, and quick tests indicate that these data can be used to classify trees fairly accurately. What could be done is that we can use field data from the drone images as the training data and classify all the trees in drone images based on that data. Our labeled ground reference data for this work contained around 3000 trees, but this way we can easily acquire several times more. Having more data means more accurate models and more accurate end results. As we are only interested in the species and not the other forest attributes (diameter at breast height, total growing stock volume), using drone data as an alternative for field measurements is a valid alternative.
Another, more useful but also more difficult direction is to go higher in the air: Satellite imagery. While drones have superior spatial resolution and airborne hyperspectral flights have good spatial and outstanding spectral resolution, their spatial and temporal coverage (and monetary costs) are not usable for either operational or nation-wide tree species mapping. Most accessible satellite data are Sentinel-2 images, with 5 day temporal resolution. However, Sentinel-2 images have, depending on the spectral band, 10m, 20m, or 60m spatial resolution, making the classification and detection of individual trees impossible. The problem changes here into a segmentation tasks for main tree species within each 10x10m pixel. We have cloudless Sentinel-2 image from our study area (dated three days later than airborne hyperspectral data) which means that ground reference is correct. Even more, we have 5 month cloudless time series data which will help distinguishing between deciduous and evergreen trees, and even betwen different deciduous species (European aspen grows its leaves a couple of weeks later than birch). The downside is that by Sentinel-2 standards, 83km² is a really small area. In any case, the ground reference data about tree species will be a lot more accurate than existing land or forest cover maps, albeit only for the small area.
There are, of course, commercial satellites such as WorldView-3, used here, but they are not freely available.
About me
I’m currently working as a researcher at SYKE, with a background of M.Sc in computer science and I’ve somehow ended up to work with remote sensing data . I did my master’s about Land cover classification from Sentinel 2 images.
5 Likes