Hi,
I’ve a doubt in assigning cat_names and cont_names.
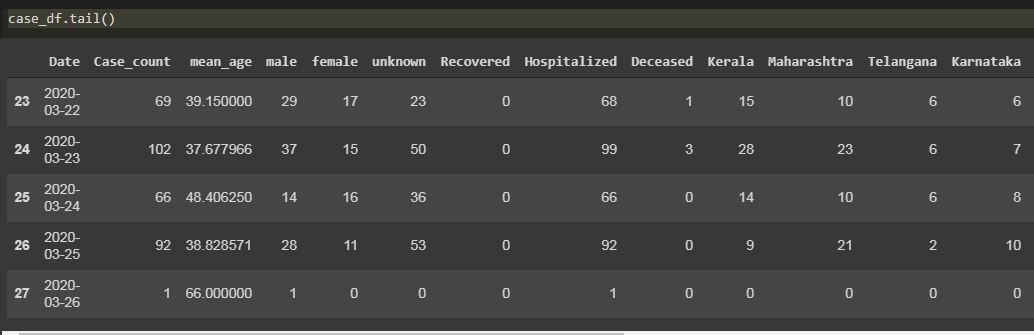
If a column contains int values(1 to 150) should it be under categorical or continuous names?
Also when I set such a column as dependent variable, by default it is being converted to float. How do I change it back to int?
That’s up to the data and the practitioner. Does it have some representation of order? Do those numbers cooralate to categories? What I mean is I could represent the numbers in a deck as 1-13, but as each have suits and numbers I could also fit them into categories because of the fact each number represents something and 4 of the cards in a deck will fall into that particular category.
Try setting the y_block explicitly to CategoryBlock. Could be picking up the numbers and assuming regression
It is actually number of deaths. So it doesn’t represent a category or order. But if i put it in cont_var, they are converted into float and number of deaths should be in int.
"
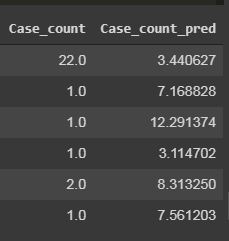
y_var is the number of cases, so it should actually be a regression right?
And the predictions doesn’t look like a prediction, just some random values with 0% accuracy.
Does that mean the data is not enough to correlate or there is no correlation between the values in the dataframe? (Although the data size was just 28 rows)
Is tabular model the right approach to deal with this or creating a best fit line model like jeremy did in SGD lesson (part-1) would be better?
Hii @zdw2126062 yeah he did clear my doubts.
Also, I’m little confused about which approach to use.
The problem is there is not enough data, i.e. only 30 rows and hence can’t use a deep learning approach i guess. I tried with XGBoost also and it didn’t seem to learn anything.
So what is the best approach for this kind of problem?
I have a situation where I am trying to retrain a model on new data. However, it is possible that the new data might have a category that was not in the original model. Say I was modeling store sales overtime and I don’t have the ability to retrain the model on the entire data set and I want to train on a new time period with the old weights and old embeddings. I realize that retraining on a new data set is likely to lead to catastrophic forgetting.
I have tested different time periods in the model and it seems the embeddings for the model are created when you create the learner. I am using fastai2 and I have successfully changed the learn.dls to a new dataloader that was processed with the first tabularpandas and then fit the model again with the new dataset. However, even though the model trains, the embeddings of the model don’t increase the number of classes for later occurring categorical variables.
As an example, I make the first model on January only so Month as a categorical variable only sees 1, so I have na + January in the embedding. The next data set I process with the first tabular pandas is January to december and the new data_loader.classes is correct. na + 1-12 so 13 dimensions.
If I overwrite the learn.dls with this new dataloader and do learn.fit(1) the model trains. However the embedding matrix is still only 2 dimensional like the old one. Is there away to keep the old coefficients for the continuous variables and update the embedding matrices on the fly instead of just training the model on all data from the beginning? I guess the width of the embedding matrix is also made taking the length of the unique number of categorical entries into account, so the dimensions of the matrices will likely be off anyway.
Is there anyway to do what I am trying to do here?
I guess you have two possibilities in your scenario.
Either directly increase the embedding size during initial training with your first dataset, which is probably the most straightforward solution. In this scenario, the learned embedding on the initial dataset would have too many parameters, but personally, I always use the maximum number of categories based on my domain knowledge. This process assures that your network still works on unseen data. Another approach would be to replace the respective embedding layer after the initial training. This replacing requires more work as you need to get the model from the learner, find the correct embedding layer and replace it with a new one.
To set the appropriate embedding size for the first scenario you would need to the correct number in emb_szs as far as I understand, see also https://dev.fast.ai/tabular.learner.
However, with a link to a notebook or some exemplary source code, we could help you in detail.
It’s detailed in the notebook but basically there are two functions added, learn.explain and plot_explain. The first of which will grab your (loss function) decoded y’s, the masks, and the explainers. You simply pass in a DataLoader. plot_explain will accept a list of masks (your output from learn.explain) and a list of labels for the x axis (which should be dls.x_names) and a figsize. From there it’ll plot each importance from each input. The lighter in color the more it was utilized
I’m 99% sure this implementation is correct, checking with the devs on the categorical variables
In the previous fastai course jeremy say:
To deal with time series data we can do add_date_part() which creates new date/week/month columns and then can be treated as a regular tabular data.
Why are we not using that approach?
Can we use datablock api for the previous tab data we dealt with (adults or rossman)? if yes what are the datablocks should we use?
I mean here we use DataBlocks() and specify the names of the block.
But what we did previously seemed to be a lot different, in sense, we used TabularPandas, created tab object(to) and then created data loaders and fed it into the our learner.
Also we don’t get to take a look at our data, like the df.head()
Ah I understand now. At the moment tabular is it’s own thing, the TabularPandas. There was a few working variations for the DataBlock for say multi-input IIRC but you should really just use this interface as TabularPandas is very powerful.
And sure you can, you can call a .show_batch() at your to’s
Oh okay i get it.
Being used to the previous version for quite a long time, I find it difficult to adapt to this new version, all these new concepts and variations are kinda overwhelming
Just play around with it for a while to get a feel for it, that’s how I learned I didn’t go explore the source I just used the interfaces for many hours and got a feel for it
 Here’s the relevent links to tonights discussion: