Hi everyone!
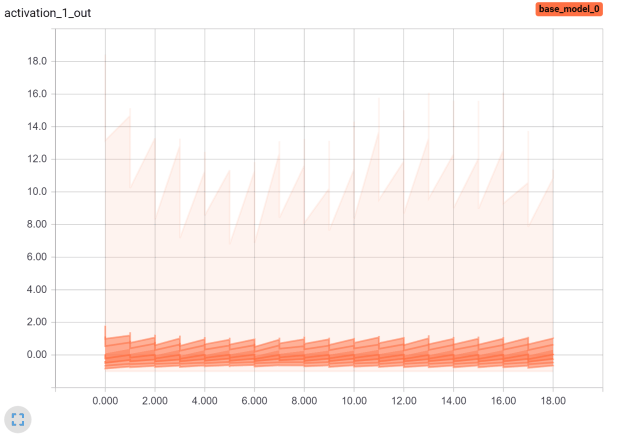
Can someone please help me diagnose what’s going on with my model. I use Tensorboard to look at my model activations and it shows some weird sawtooth-like pattern for many of my activations. It looks as if activations are increasing over the epoch and then drop at the beginning of the next epoch. I’m totally confused about potential reasons for such a behavior. Any ideas what can cause it?
This is a DenseNet model
I just started using Tensorboard and have not developed any workflow yet. If you have any resources on how to use Tensorboard effectively to debug models - please share. (I’ve seen Dandelion’s presentation from Dev Summit).