I am working on the spooky author kaggle comp and just ran into a somewhat weird plot when looking for the appropriate learning rate.
When I was using lr_find with the original data, the plot looked as one would expect. but I modified the data to move the labels into bool category columns, created a validation set from 25% of the training data and the learning rate plot developed a tumor!
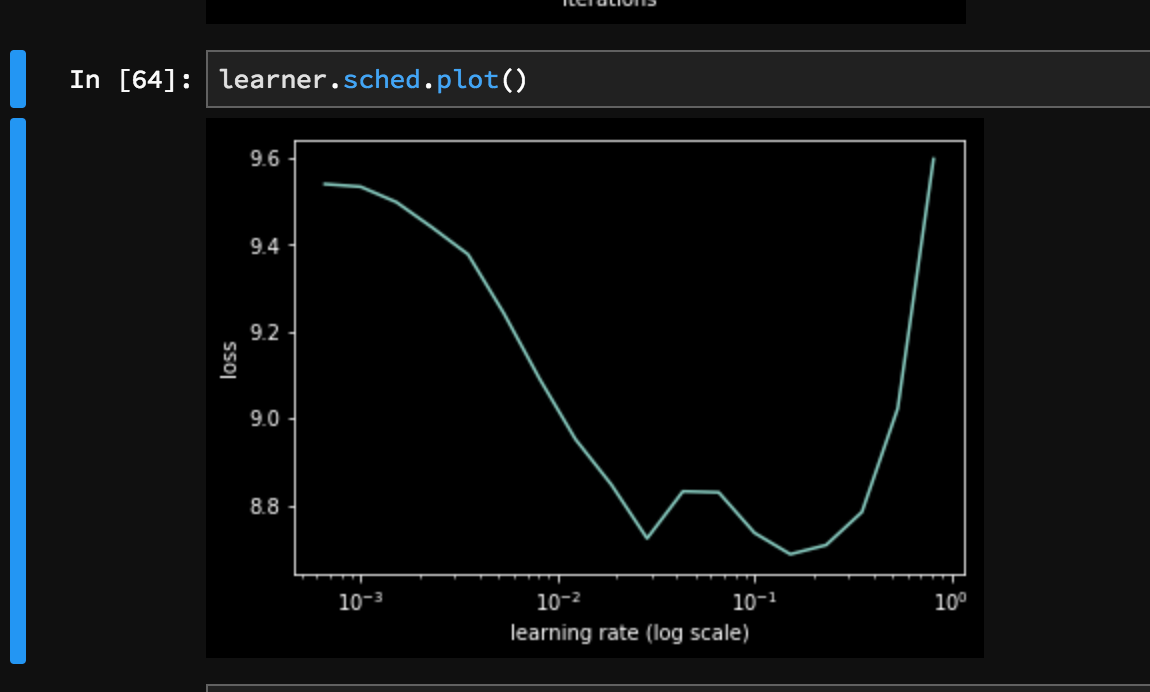
I don’t understand what did you find unsettling. Is it the little hill just before 10^-1?
However, that looks like a normal plot. It’s just that your modifications altered the loss surface. Something a bit smaller than 10^-2 (dunno… 7x10^-3?) should be a good choice…
Thanks, I haven’t seen a learning rate plot with a hump like that yet, so had no idea if that was normal or not. My accuracy is way lower than expected so I wanted to weed out potentially issues.