As suggested in video lecture , I am experimenting with Orange and Lemons data - My data as follows
print number of files in each folder
training data: Lemons :71
training data: Oranges:73
validation data: Lemons:20
validation data: dogs:21
test data :32
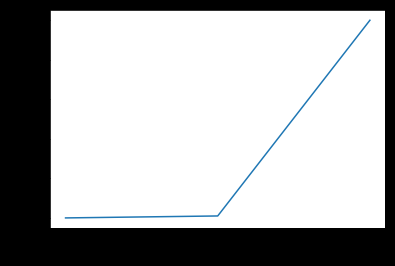
But unlike what was explained in the video, The Learning rate find method runs for 100 %
The plot learning rate Vs iterations came out like this
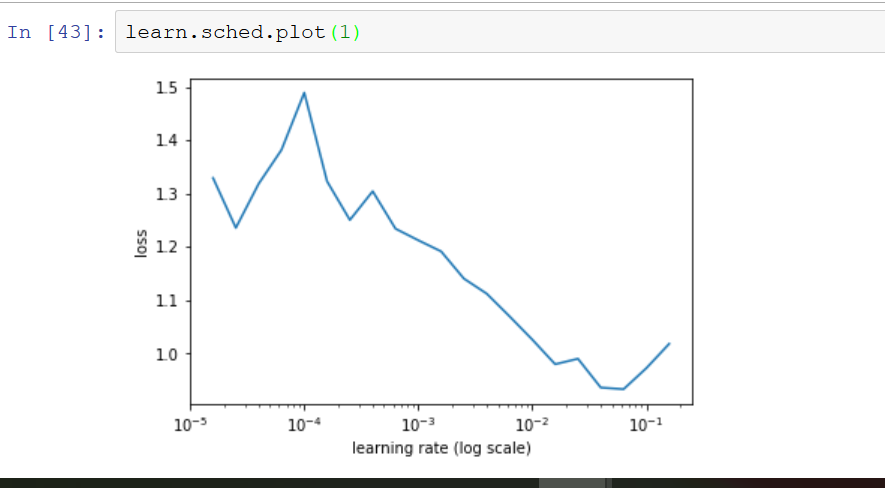
The plot of loss versus learning rate was blank

I have tried different combination of Train -validation-test combination but I am not seeing any change > i am wondering where I am going wrong
fyi
I set the batch size as 10
data = ImageClassifierData.from_paths(PATH, tfms=tfms_from_model(arch, sz), bs=10)