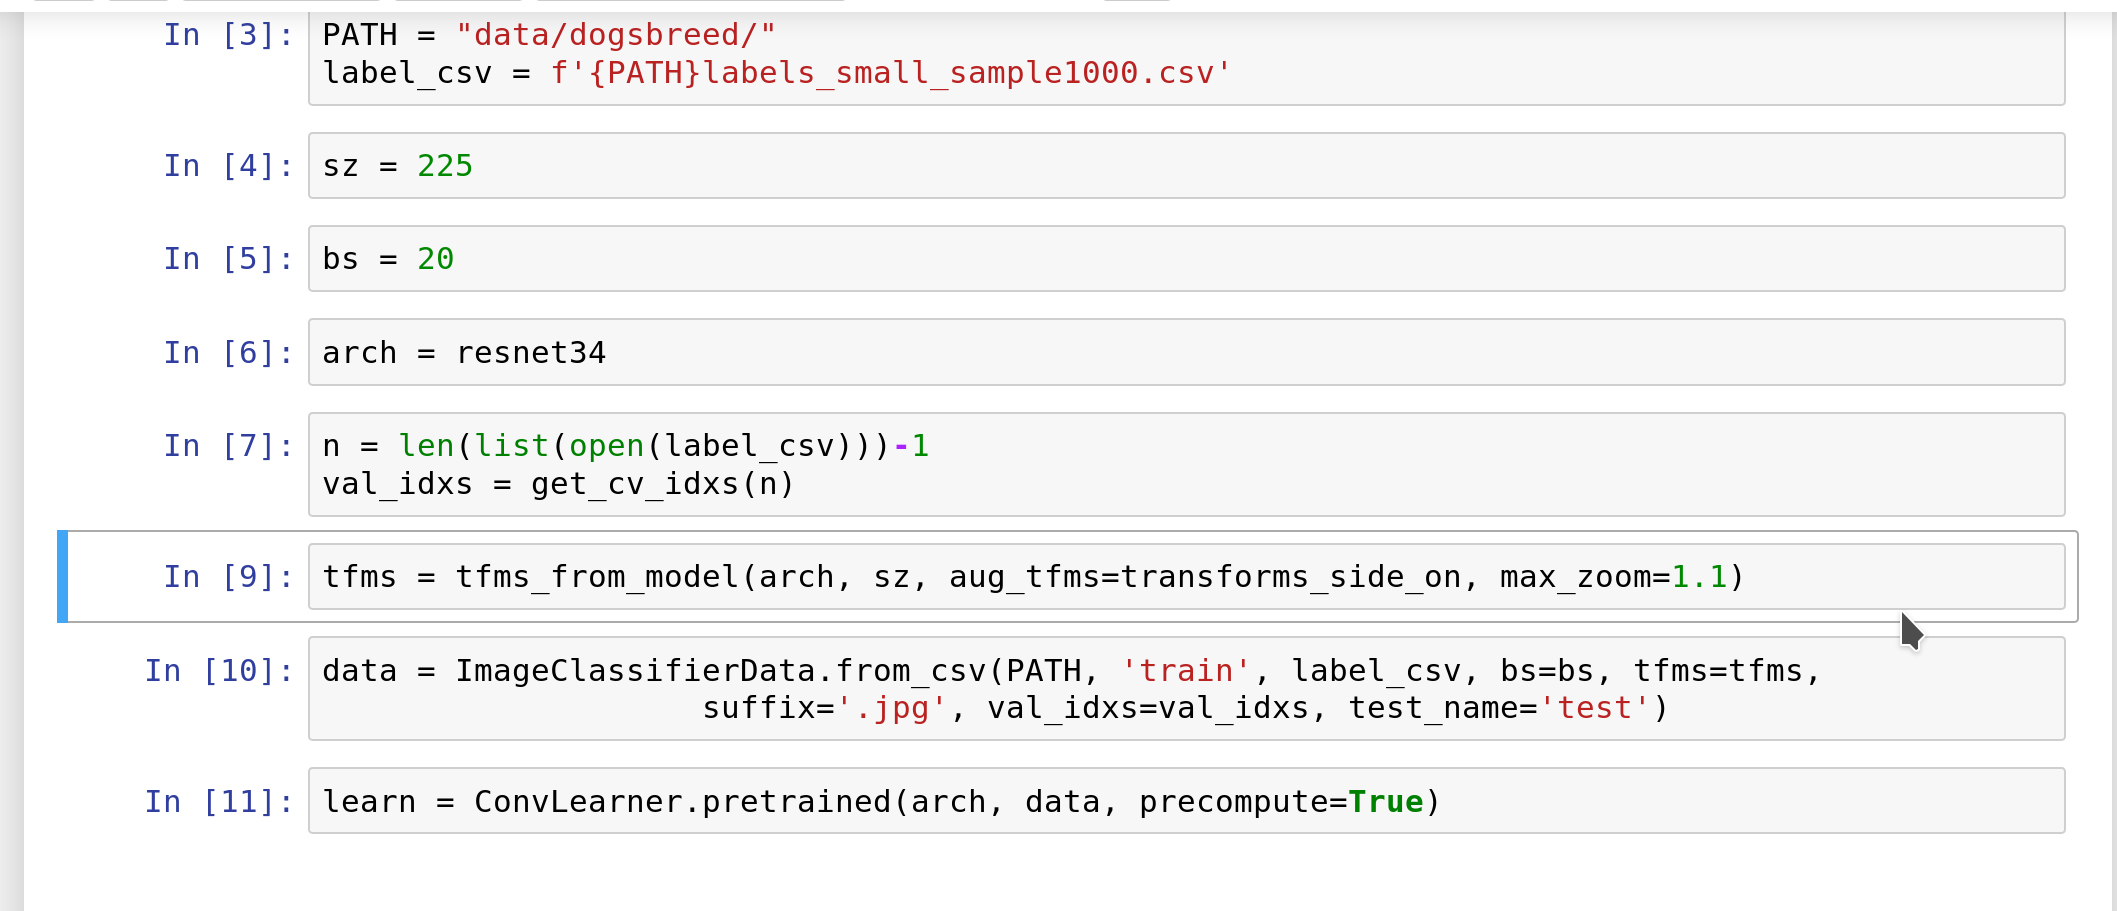
I have the following problem: I tried to do the dog breed competition, and in order to be able to use my personal machine without waiting too much, I took only the first 1001 rows of the .csv table.
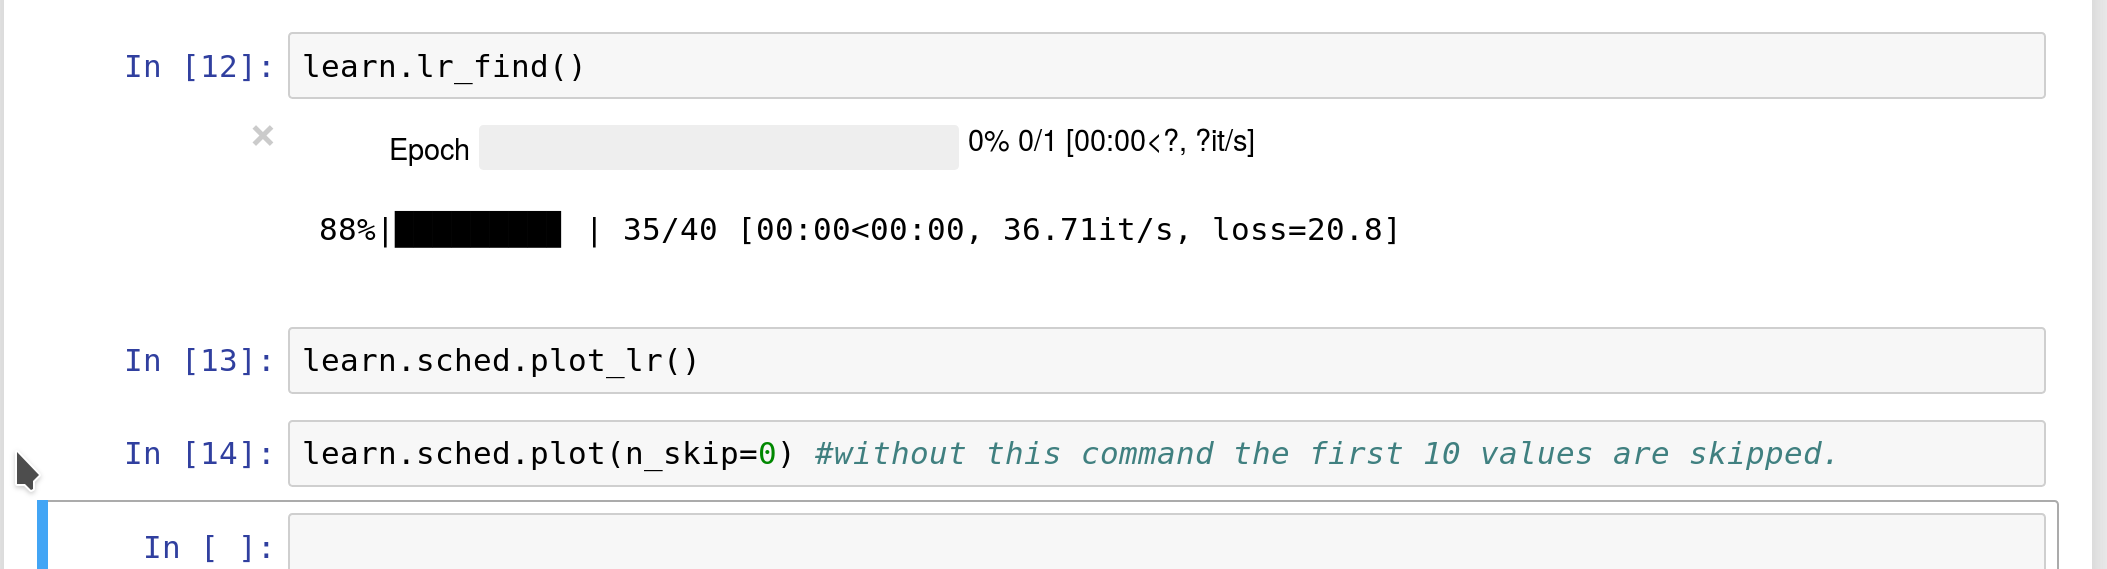
But when I try to use the learning rate finder, nothing happens. I don’t think that I am in the case explained here:
I encountered the same issue. Inside the method that plots the learning rate, there is a piece that doesn’t work reliably inside a jupyter notebook. I think there is a merge request on github with a discussion on this.
Not sure what the status is and can’t check right now nor can’t look this up for you in code. The way I fixed this was by commenting out an if condition. If you installed fastai using pip this might be a bit more challenging but if you are just requiring the library that sits locally in a directory on your hard drive, then you can fix this by searching for wherever plot_lr is defined and messing with the if condition.
Ok, did a quick search:
    def plot_lr(self):
        if not in_ipynb():
            plt.switch_backend('agg')
        plt.xlabel("iterations")
        plt.ylabel("learning rate")
        plt.plot(self.iterations, self.lrs)
        if not in_ipynb():
            plt.savefig(os.path.join(self.save_path, 'lr_plot.png'))
I am quite sure this will be fixed soon so maybe look up the discussion or github or just give it a couple of days Such things are to be expected when you are on the cutting edge
Thank you for the correction. I must be making multiple errors because now the plot function is working again (without restoring sgdr).
Edit:
I think my dataset is too small. If I reduce the batch size to 2 then I can get a plot.
I downloaded a horses vs donkeys dataset from kaggle and I might need a better distribution between test/train/valid. I put 267 images in the validation set.
The question I should be asking: What should batch size be in relation to dataset size?
Ah sorry - seems the correct way of looking for the right lr is to first do learn.lr_find() and then learn.sched.plot(). Sorry for the earlier incorrect info.
Horses vs donkeys sounds very neat Good luck with your project!
I do not have a lot of training images ~ around 400 images per class. I had a blank plot but I tried decreasing the batch size from whatever the default value was to 8 like this:
I think the issue is with the way that fastai imports matplotlib. Adding this to my import statements worked for me:
import matplotlib.pyplot as plt
%matplotlib inline
In case anyone is still stuck on this, I encountered this issue and it turned out to be simple - I had accidentally changed the notebook cell type to “Raw NBConvert”. It took a while to notice because the font was the same monospace font as the normal code cells. (However, NBConvert cells don’t show the “In[X]” label to the left, and evaluating it doesn’t produce an output cell.)
This was working fine for me till recently and suddenly it stopped working. I have not made any change. I run using Google colab. And today’s run is not showing any plot. I tried making changes to sgdr as suggested. Still no impact. Any help?
 Such things are to be expected when you are on the cutting edge