For practice, I am analyzing the Dog Breed data.
I create a learner
learn_faster = ConvLearner.pretrained(arch, data, precompute=True)
Then I run the learning rate finder.
lrf=learn_faster.lr_find()
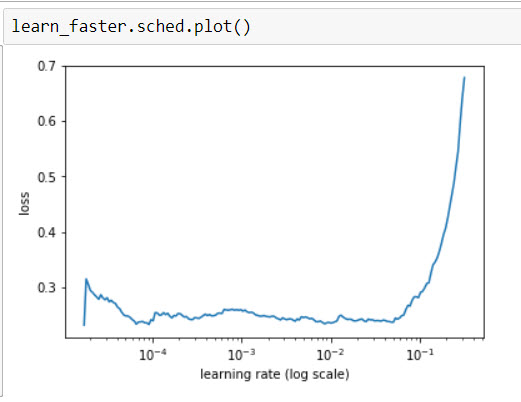
which gives me a learn_faster.sched.plot() result:
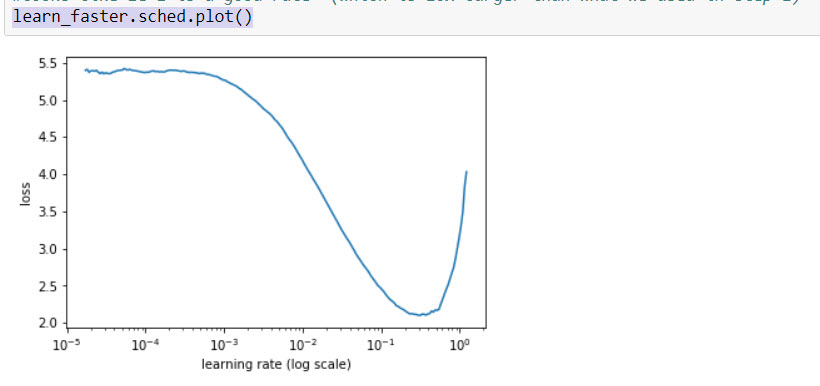
This shape makes sense – a learning rate of 0.05 to 0.01 is probably ok.
So I learn_faster.fit(0.01,2) to better fit the network.
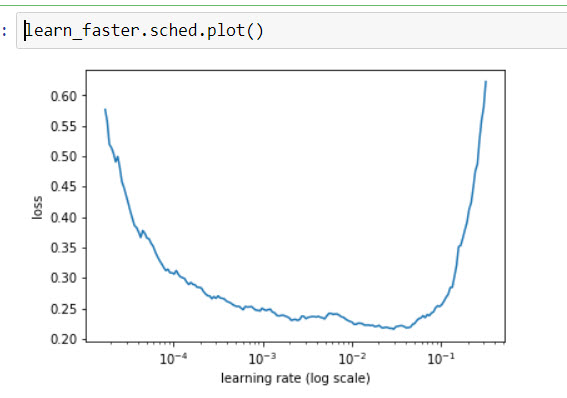
For fun, I run the lrf=learn_faster.lr_find() again
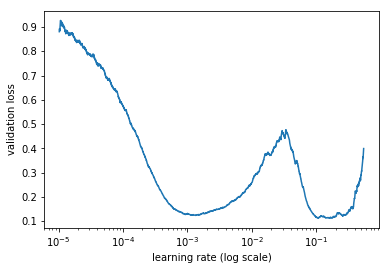
The learn_faster.sched.plot() looks more bowl-like
Now it looks like the learning rate is more like 1e-4 or 1e-5, so I fit again: learn_faster.fit(1e-5,2)
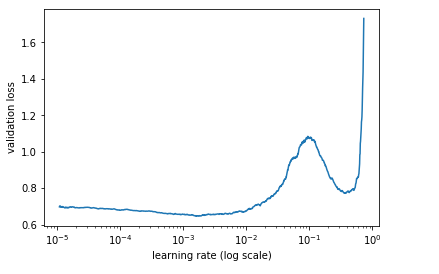
Now the learn_faster.sched.plot() is almost flat.
How I interpret this is this model has been .fit to the point that further fitting will make no improvement to the model. And if I choose aggressive fitting parameter (0.1+) then I’d just jump out of the minima I’m sitting in right now.
This corresponds with what I’m seeing on the accuracy results of each subsequent fit. The measurements never improved from the initial 92% I enjoyed on the first run, in fact worsened slightly as the fitting went on.
My question is: am I interpreting this chart correctly, or I am dong something stupid that is poisoning the results?