Lets talk about it formally.
Note that there’s lots of great kernels for this competition. Makes it much easier to get started.
I seem to keep running into memory issues when trying to do simple pandas DataFrame operations. Does anyone have any advice for this? Specifically on this operation:
dep = 'unit_sales’
joined_test[dep] = 0
joined = joined[cat_vars+contin_vars+[dep, ‘date’, ‘id’]] #This line here where cat_vars and contin_vars are arrays of the appropriate column names
I have tried releasing the older dataframes from memory that are joined into this final joined dataframe as well as tried using the gc module and calling gc.collect().
I’m using the aws p2.xlarge instance. Is working with this size of dataset not realistic with the p2.xlarge instances? Has anyone had any success with this competition so far?
3 Likes
I’ve managed to do it on p2.xlarge. But I had to make sure all my data types were suitable - I used the tricks from the kaggle kernels for this.
Ah that’s a great point. I’ll try digging through the kernels then. I assumed that I could take care of typecasting after, but it makes sense that optimized data types on read in can make a massive difference when you are working with that many rows. Thanks!
I 've been playing a bit with this one to test “Structured DL”/Rossman lesson. I wanted to make sure I got everything right so trying a “vanilla” structured model. Ok, maybe not vanilla vanilla, just as vanilla as Fast.ai tools can be.
Now, what I find weird is up to this moment I haven’t even reached the “last year sales” benchmark. Admittedly, I’ve done 0 feature engineering, (also no weighting by products) but still Im surprised that a model that was top 10 in Rossman doesn’t even make it to, say, 50% of LB.
This is an open competition so we can not share here in much detail but my general question is, are you guys achieving ok-ish results with Rossman lesson approach? If not… what do you think would be the difference among both competitions that justify the difference in performance?**
I’m working on it right now. I had struggled with some minors issues. I keep you posted when I get to the results part.
1 Like
I can get top 10% with the Rossman approach. Note that the zero sales rows have been removed from the training set - you need to put them back to have any chance of a good model. Most of the kaggle kernels show how.
I’m not getting great results yet however, and I think the problem is that ~50% of rows are zero, and it depends on whether that specific store has that specific item in stock. The only way to model this, I’d guess, is to simply see whether it was in stock recently or not.
4 Likes
I’ve tried to build a basic model for Favorita, using fasta.ai library and based on the Rossmann notebook, after watching DL1 Lesson 4 and ML1 Lesson 3 videos.
Note: I worked for Carrefour, like Walmart for EU, as hypermarket store manager for 2 years then in Purchasing/Marketing HQ for another 2 years, so I’ve done sales/inventory predictions a lot, old-school style.
I kept things as basic as possible to start, like not including national/local holidays nor working on Durations or adjusting/counting the # of week-ends for each month. I clipped the “Unit_Sales” negative values or returns to 0.
Also I chose to work on June-August 2016 data as it’s complete, with the idea of Training on 8 weeks and Validating on 2 weeks (ie same ones as the Test 2017 data).
I’ve played around different fixes/versions in the past 2 days but I can’t get the model to “take-off”: it won’t figure the learning_rate, running basic epochs generate “NaN” results, so I don’t know what to do next.
To comply with Kaggle rules, I posted this notebook’s code in a public kernel here with a link to this now public thread.
My basic notebook, as ran/saved, can be viewed:
Or downloaded on GitHub:
Any idea/tip ?
I am also working on this  Thus far reproduced the submission based on medians / averages and working on hammering data into shape for a mixed input model.
The Rossman notebook is really great - walking through it while looking at the fastai library code makes for an invaluable learning experience.
1 Like
This comp is very different from rossmann. First off there are transactions by store by date. I will let you figure out what you do with that - it is sort of a planned data leakage that you are supposed to use. Very tricky. J.h. Should do a little sidebar on data leaks. Very non-academic - very real world…
The real challenge are the items in test that are not in train. Maybe someone can RECOMMEND unit sales for these new items.
By the way the imports/ libraries written for image classification are real good. They should be added to pytorch disto. Saved me at least 200 hours as I was writing my own.
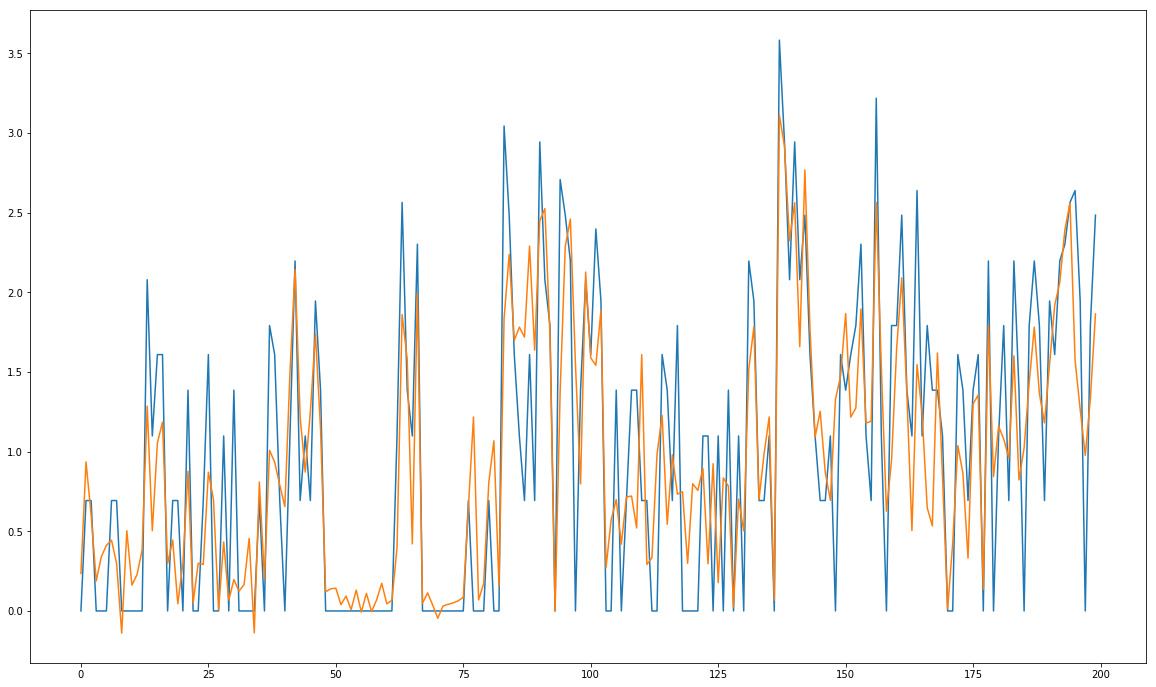
I am working on a hybrid architecture using LSTM and embeddings, So far validation seems to be promising with sample data but it will need a lot of computing time for full data training.
Here is a sample validation predictions:
3 Likes
How is it coming along Kerem? I must say that graph looks really good
I stayed up till 3 AM yesterday which is by all means extremely silly of me but I managed to complete my first neural net submission with embeddings  The results were ridiculously bad as I scored 0.727 on the LB. To some extent I understand that the results are very telling, but on the other hand I do not think that this whole experience of working on this can be just judged through how poor the score was - I learned quite a lot and had to solve quite a few problems to get to this point.
Anyhow, thankfully still 8 days to go so I am looking forward to improving my score Had to do a bit of driving today which gave me an opportunity to think on this and there are several hypotheses I would like to verify. Quite hoping I am onto something but we will have to wait and see!
2 Likes
Hello,
It’s very nice to see that the competetion is being very fruitful for you in terms of learning exprience. So far my best lb score is 0.552 but this is before adding dropout and batchnorm. Right now, I am preparing to travel back to San Francisco and I will focus on it more before the competition ends when I am back. If you wish I can share my notebook with you in private we can team up since it’s against rules otherwise.
I think the main problem of my weak score compared to GBM based solutions is due to optimization. Because all the best kernels rely on moving statistics of unit sales and promotions with different time spans. In theory I believe LSTM should capture the time dependence and embeddings should capture categorical effects on sales. But this is of course just a hypothesis
2 Likes
I’m also trying my hand at this. Took a random sample of 10% of th data set and then removed all <0 and > 150. Validating on last 2 weeks of 7-2017. Results are not very encouraging. May be I’ll try with full 2016-2017 data considering all values.
Brilliant !!
You could add these as features in your neural net too…
2 Likes
I’m clearing a last code issue applying the principles from Rossman (ie proc_df()) but if you’d like to discuss business insights (cf my experience at Carrefour Supermarkets above) or team up, l’d be happy to.
1 Like
Thank you - I really appreciate both your offers. I do not think I would be able to contribute much to your LB standing at this point though given where I am myself with the solution ![]() Also, given that I do not know how much time I will be able to give this over the coming days, on one hand I would feel bad if we were to team up and I wouldn’t give this a good amount of effort, on the other hand I would like to give whatever time I will be able to to continue exploring the approach I started to take, mostly to satisfy my curiosity but also via continuing down the path I started on and seeing what works and what doesn’t I think I am learning quite a bit.
Also, given that I do not know how much time I will be able to give this over the coming days, on one hand I would feel bad if we were to team up and I wouldn’t give this a good amount of effort, on the other hand I would like to give whatever time I will be able to to continue exploring the approach I started to take, mostly to satisfy my curiosity but also via continuing down the path I started on and seeing what works and what doesn’t I think I am learning quite a bit.
That is one of the things on my list I want to try next ![]() If the approach simply based on taking a median of averages gets 0.546 on LB, can I improve on this using a neural net and supplying additional information to the model?
If the approach simply based on taking a median of averages gets 0.546 on LB, can I improve on this using a neural net and supplying additional information to the model?
I also think there can be an interesting, counter intuitive dynamic here at play with the number of optimal embedding sizes given product count vs store count (and where we want to capture more info) and this is one of the things I am really keen on verifying.
A few thoughts, based on real-life experience:
-
There’s a natural rythm in sales fluctuation based on DayOfWeek, thus the name “Cadencier d’approvisionnement” (as in “Ordering/Supplying Cadence Card”) to describe the spreadsheet used for purchasing/producing goods by each section manager (fruits/vegetables, meat, fish, bakery, dairies, alcohol, flowers, etc.).
Rule of thumb in Europe: lowest daily sales are on Tuesday (base 100), highest on Friday (200+) & Saturday (300+). Impacts checkout cashiers schedule too (but not relevant here).
Weekly promotions often start on Tuesday morning, plus Monday morning super busy for shelves refilling due to max sales on Friday-Saturday.
My guess is the correct data for Ecuador is in the Transactions file (how many checkouts per day). -
Another key tool is “R/H” for “Realised / Historical”: you want to use the sales of the 3rd Saturday of August 2016 to forecast those of the 3rd Saturday of August 2017, even if calendar dates differ (might be 15 Aug 2016 and 18 Aug 2017).
-
Count the number of week-ends in the actual month: since Friday+Saturday can weight 50% of a week sales volume, you want to check if you have 4 or 5 week-ends in this year’s month.
-
Same applies to the date of salary payment: some countries pay 100% on 1st day of month, some countries pay 50% on 1st and 50% on 15th.
Note that this can be partly neutralised if credit card with end-of-month payment have strong penetration (like in France, where the end-of-month date is not the 30 or 31, but the last Friday of the month -> if Saturday is 30 Aug, huge spending because the credit card will be debited a month later, that is last Friday of September). -
Last, I don’t agree with the recommendation of “clipping the unit_sales to zero -ie getting rid of negative sales=returns- because Favorita don’t expect returns in the submission file”.
There is consumer behavior insight in returns, especially large values: most likely a defective product, maybe a recall, with potentially negative word-of-mouth or local media coverage.
It will impact short-term sales of that item_number as well as its direct competitors (“People flee Brand A, Brand B gets a 50-100% increase in sales during X weeks”.
PS: there’s a tricky missing piece of data in the competition though, which can have a nasty impact on sales -> the available inventory for each item_number. You can’t sell what you don’t have in stock.
So your model may forecast a sale figure but if the section manager didn’t (plus suppliers/logistics incidents), out-of-stock will occur = lost sales; and it’s not your model’s fault.
5 Likes