Hi!
I got those chart after lr_find()
The first is normal. What to think about the second one?
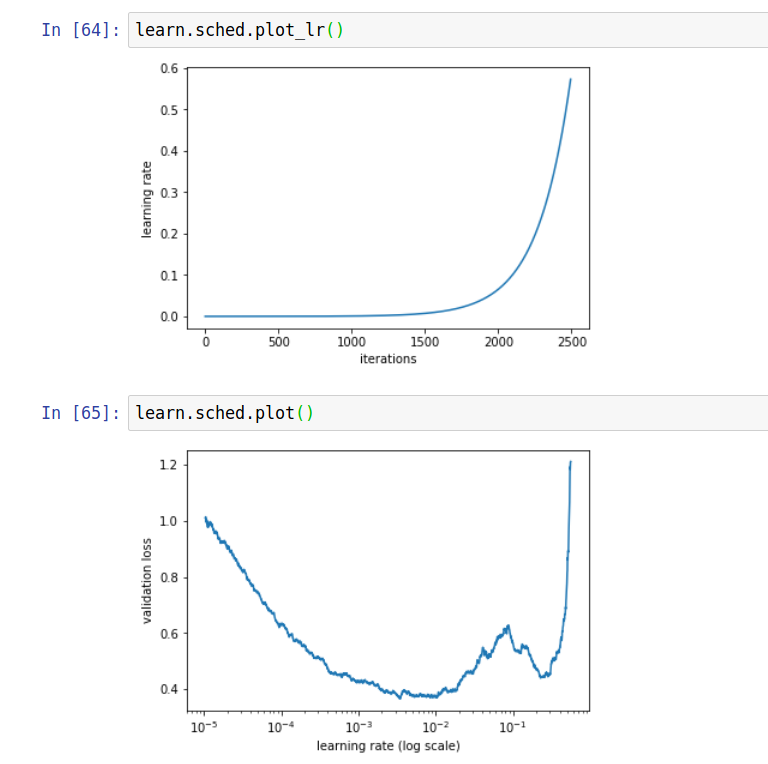
I am concerned about the upwards bump. Is it normal?
Hi!
I got those chart after lr_find()
The first is normal. What to think about the second one?
I am concerned about the upwards bump. Is it normal?
This looks unusual but I don’t think you should worry about it as the value of 10^{-2} provides the lowest validation loss anyway so you should stick to it.
What kind of data and architecture are you using? What is the batch size?
Thanks!
I moved on with this project.
I try for Kaggle:
sz = 96 #tif images 96x96
arch = resnext50
bs = 112
My repository will be updated today, it is