Hi everyone !
During the lecture I struggled to understand why the function plot_top_losses, which outputs the top errors the model made with the image and some more info, showed a probability of 1.00 for the right class for some of the images the model got wrong. If the model got it wrong, it shouldn’t give the right class a probability of 1.00, right ?
With the help of @KevinB and a dive into the source code I think I finally understood what’s happening. Hopefully this will help someone else.
Here’s an example of output of the plot_top_losses function
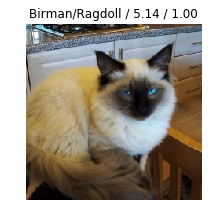
In this example, the model thought this was a Birman cat when in fact it was a Ragdoll cat. The loss on this data was of 5.14, and the probability of the Ragdoll class was… 1.00. Weird right ?
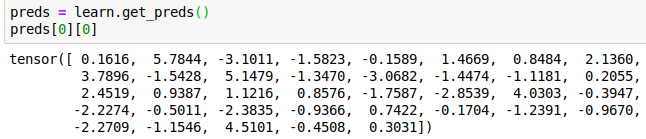
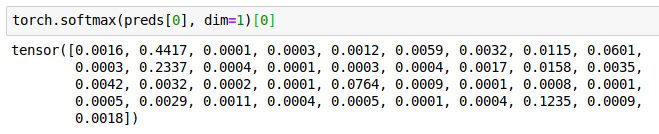
Well, here’s all the predictions for that example :
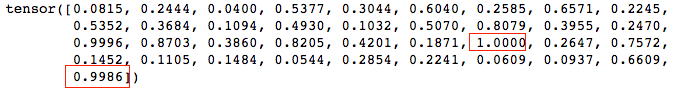
In red are the two interesting predictions (and keep in mind, these aren’t really probabilities and we can’t even think of them as such, as they don’t add up to 1 – they are only numbers the model output for each class, the higher the more probable the class is) :
- 1.000 is the prediction for the Birman class (index 24). It’s the highest so that’s what the model predicted.
- 0.9986 is the prediction for the real class (Ragdoll). We can see it’s really close to 1.
Now let’s look at what plot_top_losses is showing :
f'{classes[self.pred_class[idx]]}/{classes[t[1]]} / {self.losses[idx]:.2f} /
{self.probs[idx][t[1]]:.2f}'
Aha ! So the last number is only showed with a precision of 2 decimal point (as indicated by .2f). Hence why 0.9986 is displayed as being 1.00 even though it’s not the highest prediction.
Voila, I hope I was clear and this will help someone !
A suggestion for the fast.ai dev team : maybe it would be clearer if plot_top_losses output the full decimals of the prediction ?