Hi all,
I just wanted to share my experience as a beginner trying to understand this course.
after i saw the videos once i was overwhelmed by the amount of details.
On the second time I also tried to go slower and play with the notebooks to make sure I understand everything, it worked fine for lesson 8/9 but on the complicated modules (callbacks for example), It was very challenging for me to follow the code.
The big step for me was when I started to combine and run the notebooks both on Jupyter Notebook and also with VS code.
the VS code let me debug the run line by line and see how we jump between modules and classes and for each module I see the local variables. at any stage it is even possible to type code on the debug console to get further details of the model.
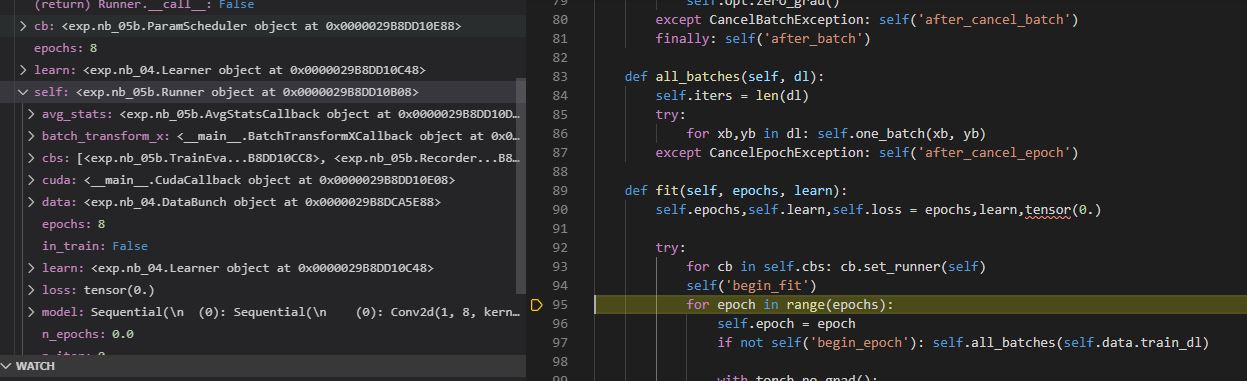
I ran the VS code on regular python mode, not as IPython which has very limited debugging options.
The VS code (or any other similar IDE) can’t replace the notebooks and have many downsides (mainly the interactive behavior of Jupyter Notebook) but combining the two was a lifesaver for me.
I’ll be happy to hear if anyone can recommend on visual debugger for Jupyter notebook (except for the basic pdb) so I won’t have to switch between the platforms.
I know that running a debugger is very basic tip, but it took me too long to give it a try. I hope it might help others.
Ran