Unable to visualize training metrics with widgets

Hi all,

I desperately try to visualize the metrics during a training using widgets!!!

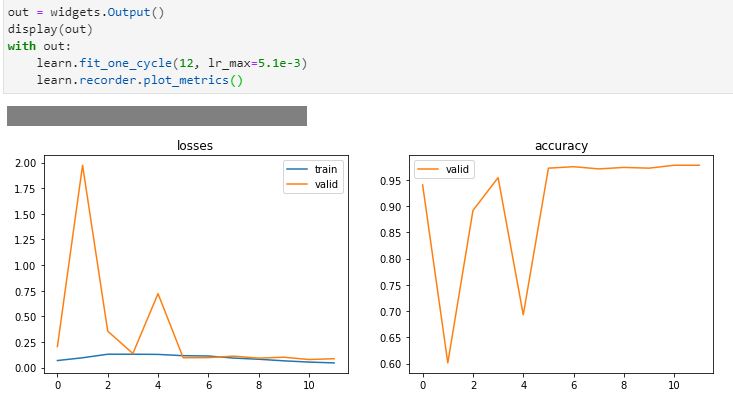
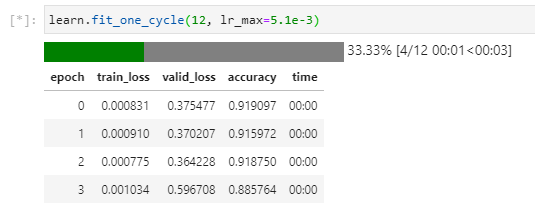
Here are the metrics with a standard jupyter notebook cell --> OK

image

Now using widgets.Output() --> Not OK

image

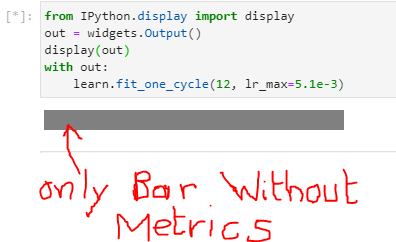
The training is correctly done but without visualization of the metrics.
Maybe the Output() widget is not the correct one to use to solve my problem, but I don’t see any other solution.
The final goal of my project is to visualize the training process through ipywidgets (or ipyvuetify) and voila.
Almost everything is fine :slight_smile: …except this part which is mandatory for me :frowning:

I hope someone can help or guide me.

Thanks in advance and have a nice and safe “happy new year” to all !!! :partying_face: :partying_face: :partying_face:

I haven’t tested but try this:

with out:
    display(learn.fit_one_cycle(12n lr_max=5.1e-3))

Also, check the documentation below to try more variant of the display class.

IPython.display

Display alone doesn’t work but I’ll look closer to the documentation.
Thanks for your answer.

I tested all the different functions and classes of display. None of them can display the metrics :frowning:
But I found something interesting: “out” widget can display graph:

So the problem seems to be related to “progress bar” preventing to display metrics.
Has anyone an idea on how to solve this issue ?
Thanks in advance and best regards