I wanted to practice by creating a CIFAR10 classifier. In this notebook, I finetuned the CIFAR10 dataset with images of increasing size.
I wanted to try the test time augmentation to see how well my model was doing, like so:
ys,y = learn.TTA()
accuracy(ys, y)
However, it appears to give me a lower accuracy (0.929 vs 0.935) than the model on its own, can it happen ? I remember from the course of last year that using TTA after training the model gave a significant increase in accuracy.
My hypothesis is that, as I work with pretty small images, data augmentation has a lot of influence on them, and can reduce the accuracy of the model. Maybe am I doing something wrong or missing something ?
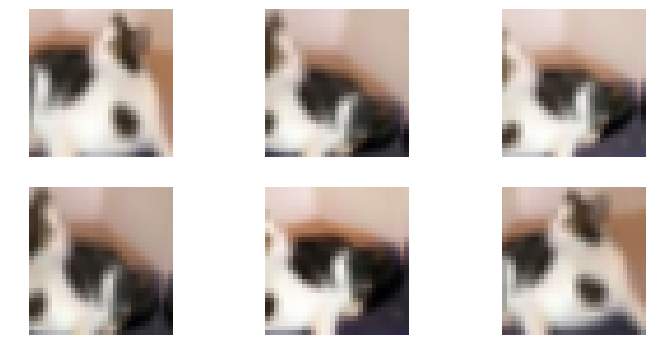
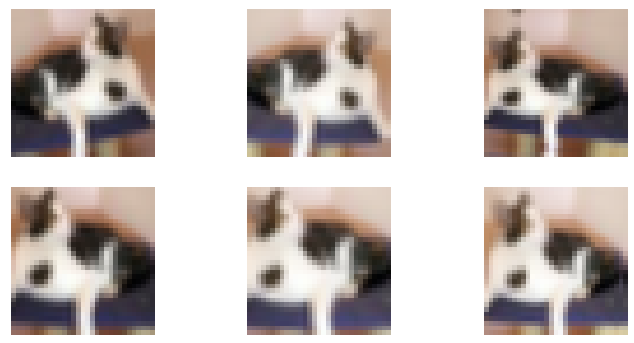
See if you can figure out how to visualize the data augmentation by plotting a view examples of a single training image. That way you can see exactly what’s going on!
I repeated the experiment. Similarly, the default TTA value makes the predicted value worse.(0.935 vs 0.937)
The following is a comparison of the results of different scale values:
Don’t know why you have different values, the gist is exactly what I did. Double check your learning rates through the notebook with the lr_finder, maybe they can slightly change from mine.
It now seems obvious why the default value leads to a lower accuracy, it even took me a while to understand what was on the first batch of pictures
It was also the first time I really dug into fastai source code, so I hope I have correctly understood and interpretated it (nice experience btw, I will do it again )
 Nice experiment.