Tabular pandas not able to replace missing values

I am using the below code -
to = TabularPandas(train, procs, cat, cont, y_names=dep_var, splits=splits)

so when I do - to.show(3), I get -

and to see the underlying items - to.items.head(3) -

Shouldn’t the missing values NaNs have been replaced by the medians or something?

This causes an error when I run the regressor -


Can someone help on this error?

First guess: did you include FillMissing in the procs?

If yes: I don’t know. It’s probably easier if you post the complete code or even better, a link to the notebook.

procs = [Categorify, FillMissing]

cond = ((train[‘Year’]<2011) & (train[‘Month’]<11))
train_idx = np.where( cond)[0]
valid_idx = np.where(~cond)[0]

splits = (list(train_idx),list(valid_idx))

cont,cat = cont_cat_split(train, 1, dep_var=dep_var)

to = TabularPandas(train, procs, cat, cont, y_names=dep_var, splits=splits)

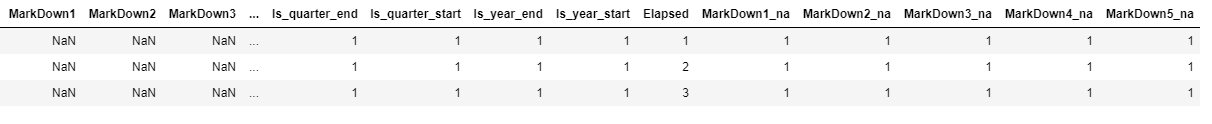
That’s strange. The NaN values should indeed be replaced by the median, or #nan for categorical columns.
The MarkDown1_na etc columns indicate that some transform has been applied, but I don’t know why it shows this behavior. Maybe someone else can help!

If it helps, I am running on kaggle where fastai version is ‘2.0.19’

FillMissing works on continuous data, as the documentation states. Categorical variables can absolutely have missing values. They get a special spot in the embedding matrix

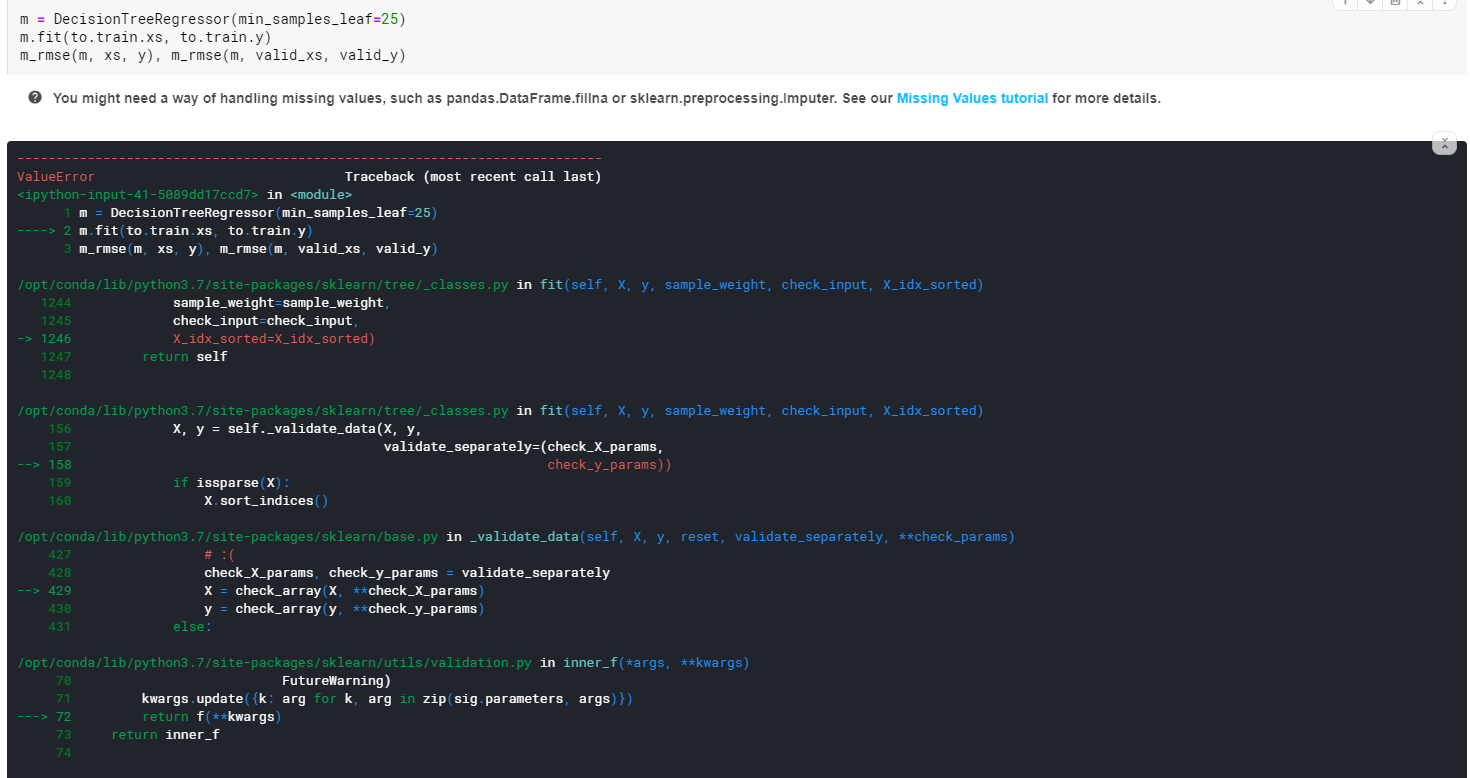
ok got it but when I run the decisiontreeregressor it throws an error because of missing values (screenshot), so how do I handle this using tabular pandas?

You should investigate your cat and cont variable names to make sure that they are how you would expect them to be. Perhaps something that should be categorical is being thrown into the continuous

(Note that this is a helper function, but that doesn’t mean it works on every single scenario)

The only columns with missing values are Markdown1-5 and when I list the cont and cat variables, I see Markdown1-5 columns appear in cont variable so it is continuous. But yet Tabularpandas is unable to replace these missing values. Not sure what I am missing here. If its not too much trouble, you can check the notebook -
https://www.kaggle.com/ritepaul/rp-walmart-sales-forcast

There is another option at play here then. What % of those columns are NA? Is it 100%?

Here is the cont variable -
[‘Store’,
‘Dept’,
‘Temperature’,
‘Fuel_Price’,
‘MarkDown1’,
‘MarkDown2’,
‘MarkDown3’,
‘MarkDown4’,
‘MarkDown5’,
‘CPI’,
‘Unemployment’,
‘Size’,
‘Year’,
‘Month’,
‘Day’,
‘Dayofyear’]

Out of which Markdown1-5 have NaNs (not all values though)
So out of total 16 continuous variables, 5 have NaNs - 31%

And also % of NaNs in each of these Mardown cols -
Markdown1 - 64.2%
Markdown2 - 73.6%
Markdown3 - 67.4%
Markdown4 - 67.9%
Markdown5 - 64%