I have a training_dataframe of the following form:
| X | Y | Z | A | B | C | D | E |
|---|---|---|---|---|---|---|---|
| 0 | 1 | 0 | 1 | 0 | 0 | 0 | 0 |
| 1 | 1 | 0 | 0 | 0 | 0 | 0 | 1 |
| 1 | 1 | 1 | 0 | 0 | 1 | 0 | 0 |
| 0 | 0 | 1 | 0 | 0 | 1 | 0 | 0 |
- features
X,Y,Zare binary variables - labels
A,B,C,D,Eare the dependent variable (each row can be one of the possible labels)
I need to predict probabilities for the test dataset like so:
| X | Y | Z | A | B | C | D | E |
|---|---|---|---|---|---|---|---|
| 0 | 1 | 0 | .76 | .11 | .01 | .00 | .12 |
| 1 | 1 | 0 | .05 | .06 | .23 | .05 | .61 |
| 1 | 1 | 1 | .10 | .14 | .54 | .13 | .09 |
| 0 | 0 | 1 | .14 | .15 | .43 | .11 | .32 |
I’m following along with the 09_tabular.ipynb notebook from fastai/fastbook to learn how to train on a tabular dataset. I ran into the following issue:
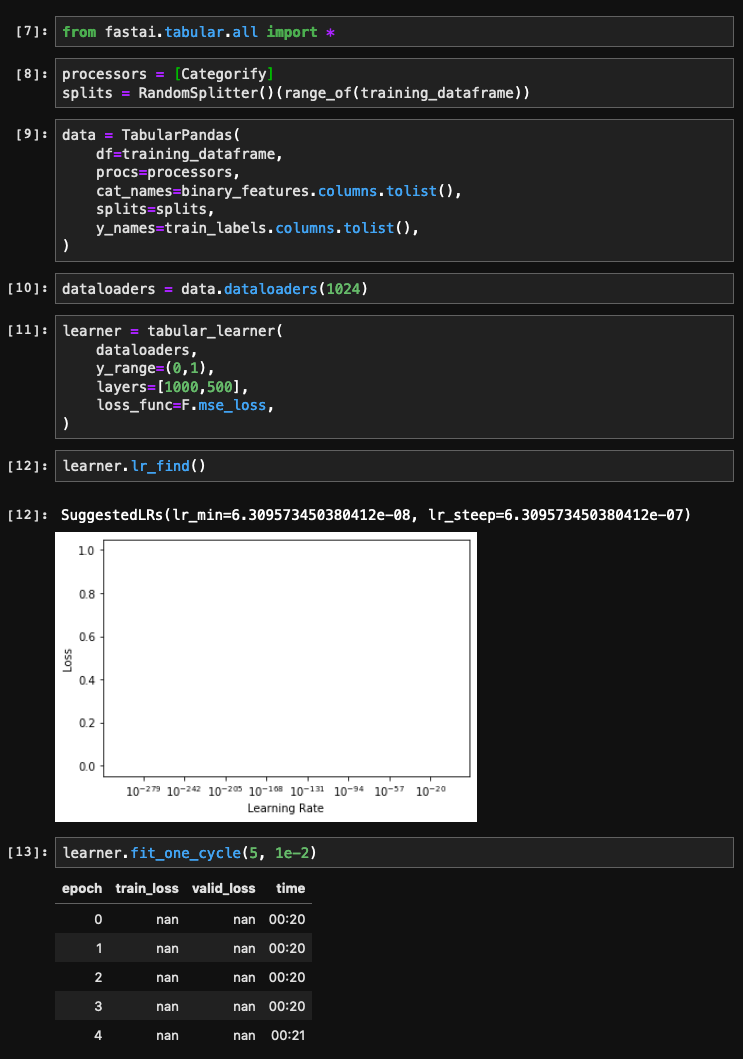
The learning rate plot is blank, and when I train, the loss is nan.
My training_dataframe has no missing values (I double checked), and every cell in the dataframe is either 0 or 1, so it’s normalized. Is there something I’m doing wrong here?
Also, how would I configure the learner to output predictions in the desired form (with probabilities for each label, summing to 1)?
If anyone can point me in the right direction, I’d really appreciate it!