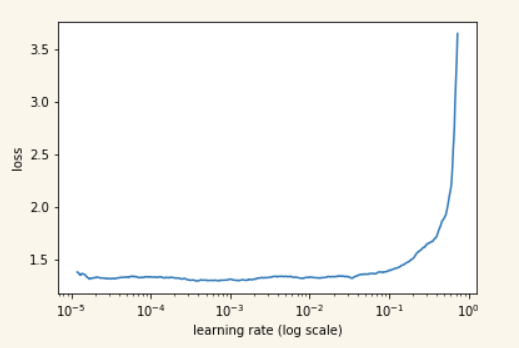
I’m trying to train resnet34 on some SAR satellite data which is 6 classes and very different than imagenet. When trying to use the LR finder I get a plot like this:
Anybody know what I should do with a LR curve like this? Accuracy at this point is only around 41%.
That’s a strange plot indeed. It seems that there’s nothing that the nn can do to get a better loss. It can only get worse.
Is this using the code from lesson 1? My first thought is that this most likely a problem with the data and not a problem with the code.
Curious about a few things: Are you using ImageClassifierData.from_paths? What is the structure of your data on disk? Also, what are the pixel dimensions of the images you are using?
Thanks for your reply. I’m using a mix of code from lesson 1 and lesson 2. I’m using from_csv. I have six classes of images, each class has about 6000 examples and every image is 160x160. The images are originally greyscale. I’ve tried using them directly as well as converting them to RGB by duplicating the single channel into three.