I am not sure if this is normal. My model does have some pictures which make it difficult to identify the object, but for most of them, the answer is pretty obvious.
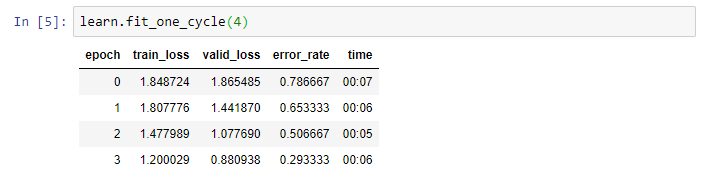
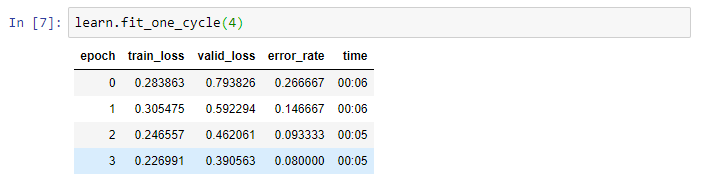
Obviously, if I train it more, the error rate will continue to decline as such:
Could someone tell me what is going on? I tried to follow the same steps the professor did in the 1st video of part 1. I am currently using the most up-to-date version of the fastai library, if that matters.
Why do you say this is a high error rate, how many classes do you have ? Don’t forget that at the very beginning, your model won’t be much better than random, so your error rate will be ok if it is better than random after the first epoch. For example, if you have 10 classes, the random error rate will be 0.9, so please check how many classes you have
I think you have uploaded twice the same image of your training step.
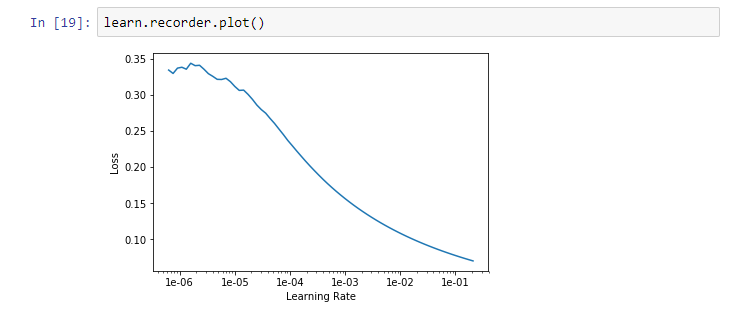
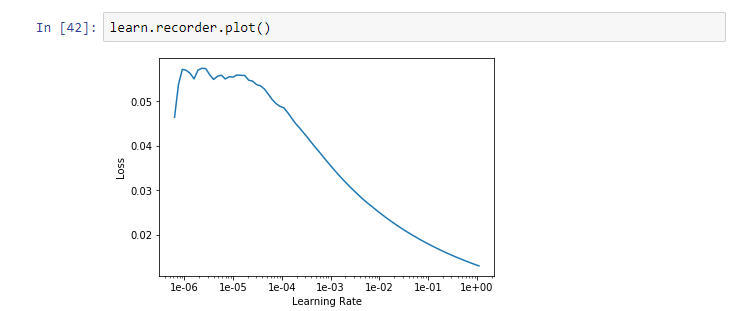
Why do you say that the graph is strange ? If it is because you don’t see the “divergent” part of the graph, then you should maybe play with the skip_end parameter, like learn.recorder.plot(skip_end=0), for example.
Hey there, I have 4 classes. Also, I say that the graph is strange because the loss goes down as the learning rate gets higher, which is not the same behavior that occurred in the lesson.
When I tried to train the unfreezed model through one epoch after choosing the lr_range(where the biggest downwards slope is), I still get a high error rate whereas the professor got a low one.
After more experience you will love that your graph looks like that. Its when it doesn’t look like that you should start to worry. Looks like you can keep training for even better results. When the graph starts to go up, you know you’re near your best possible result.
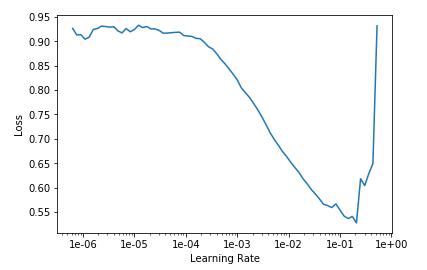
From the docs.fast.ai, this is how your lr_find will most of the time look when you use a pretrained model. You can clearly see 3 phases here:
When the learning rate is too small (from 1e-6 to 1e-4), the steps that the parameters of your model will take will be very small, resulting in almost no decrease in your loss.
You then enter in the interesting part of the graph, where the loss value decreases really fast (from 1e-4 to 1e-1), you usually want to take a learning rate value as high as possible, without being to close of the minimum (a good rule of thumb is taking that value and divide it by 10, so 1e-2 in our case)
Your learning rate is now too high, resulting in a divergent behaviour and an exploding value of the loss.
So you don’t have to worry about your graph, it is instead really promising !
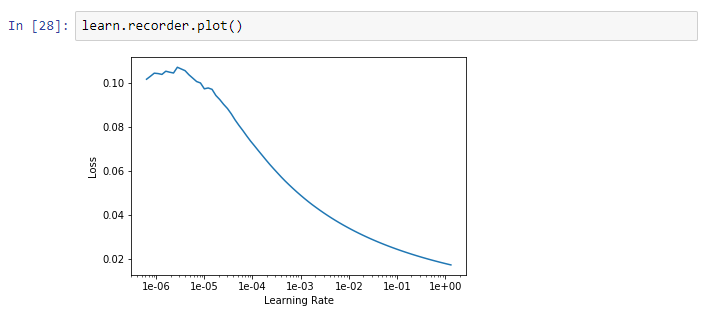
About your high error after training the unfreezed model, could you please upload some images of your training and lr_finder ? I’ll take a closer look
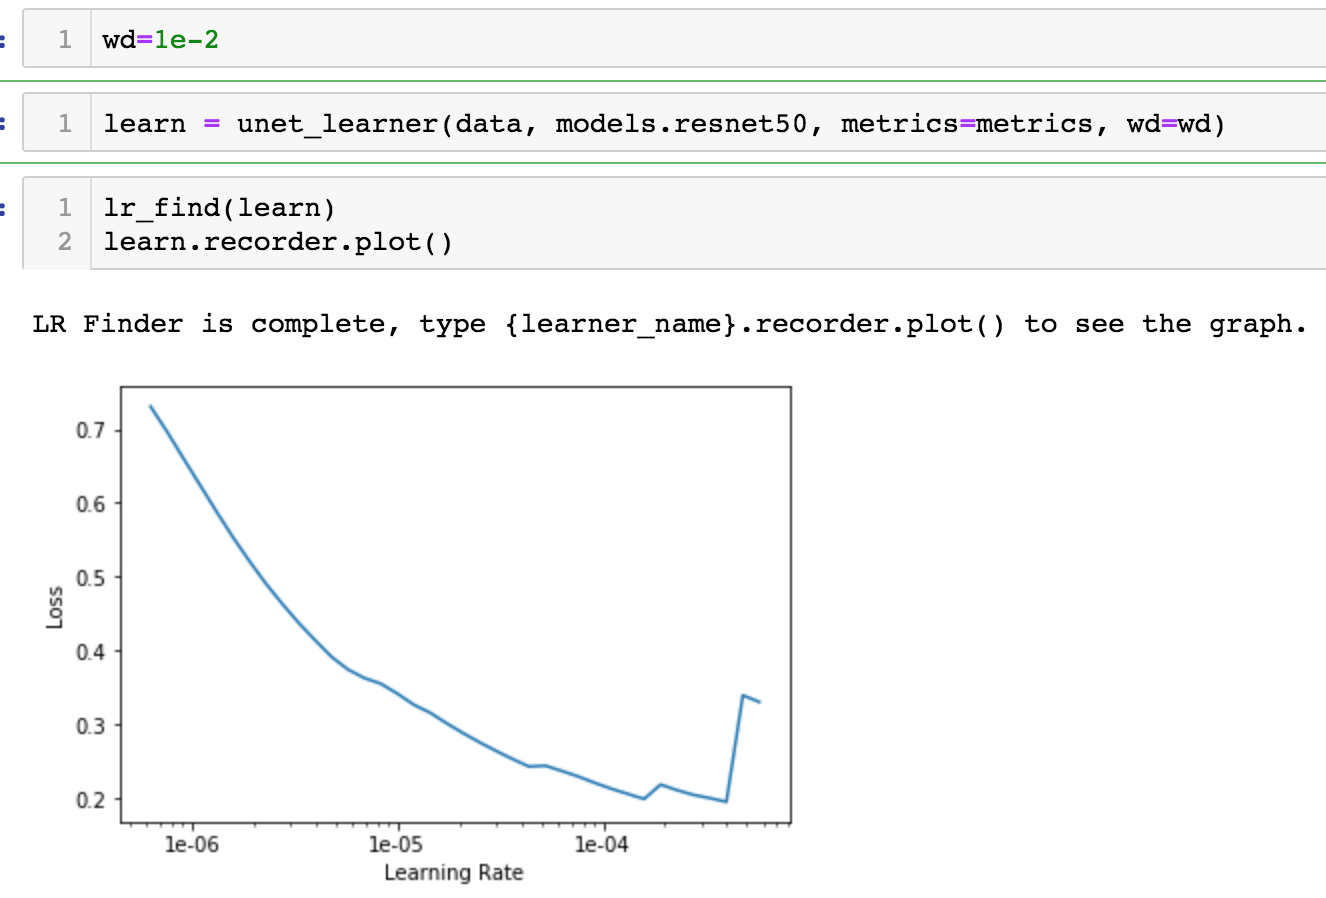
I’m pretty sure that your graph would be the same if you plotted a wider range (e.g from 1e-8 to 1e-3), you should then get the same behaviour as mine.