Hi there,
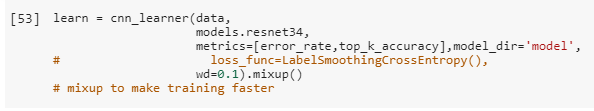
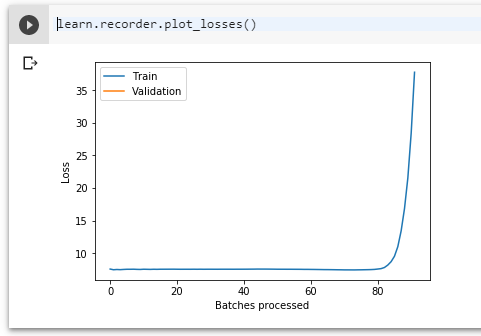
When I plot loss vs batches processed, it increases smoothly something like an exponential curve (vs expected decrease in loss on training over more samples). I also can’t find the plot for the validation loss. What is happening? Here’s my model call: