Awesome I have seen some amazing things happening with the fastai tabular framework. A winning solution for one of the kaggle competition that used k-folds and haven’t been able to completely go through that frame work, but it’s on my list.
I have worked with the tabular model and used the embedding to get better results with a random Forest, but look forward to being able to see your approach. I still think there is so much value in tabular data. Even thought nlp is what fascinates me the most.
Best Regards I’ll be back Monday night to see if you were able to upload thanks a million
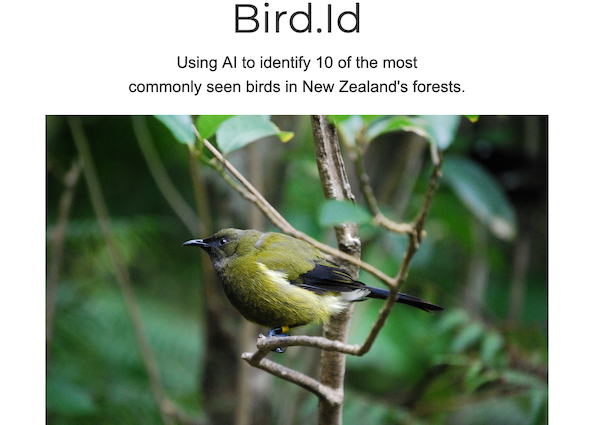
I’m currently working through a first pass of both Part I & II and wanted to share my first project - mostly to say thank you to fast.ai for such a great course.
The use case is classification of New Zealand birds, but the main aim was to get it running end-to-end to understand what that involved. [mostly this ]
Hello everyone, I am new to the community. I went through lesson 1 recently and as part of the exercise, trained a model for classifying flowers and got 70% accuracy on the test dataset. Can anyone tell how good/bad that is?
Also, I had problem adding test dataset once after ImageDatabunch object is created. I couldn’t add it via data.add_test method. I had to do the following:
test_labels = pd.read_csv(path/'test.txt', delimiter=' ', header=None)
test_labels.columns = ['image', 'label']
test = ImageList.from_df(test_labels, path)

# prediction (NOT THE BEST WAY)
preds = [learn.predict(test[x])[1].tolist() for x in range(len(test))]
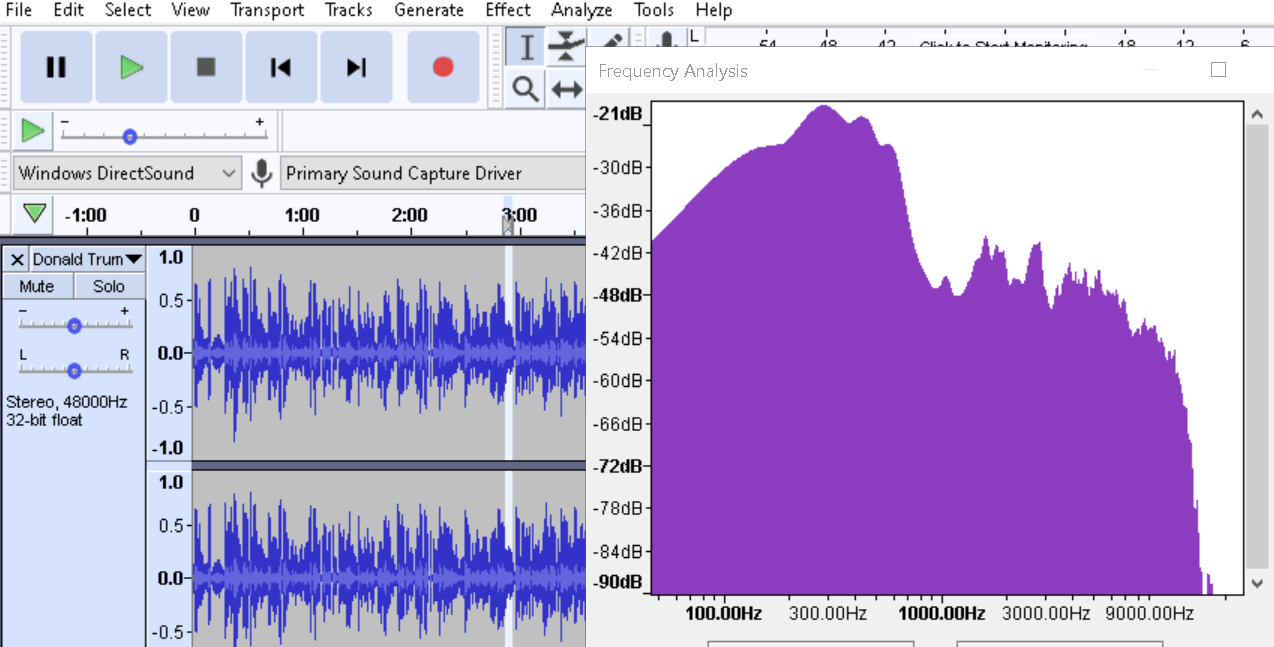
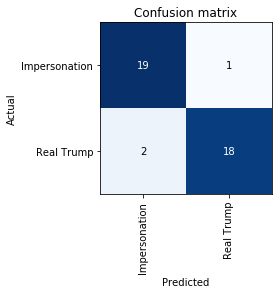
This project was inspired by @astronomy88 's project, who used audio waveforms to differentiate between the voices of Ben Affleck, Joe Rogen and Elon Musk.
I made a model that can detect whether a voice sample is real or is impersonated. I used Donald Trump as a reference, and thus built a model that can tell whether a speech sample is spoken by Donald Trump himself, or Impersonated. I got an accuracy of 92.5%, on a dataset containing 200+ frequency-domain audio spectrum graphs of hand-curated audio snippets.
Following are some details if anyone is interested.
I found some shortcomings in @astronomy88’s datasets. What he had used as data were time-domain power density graphs of the audio snippets of 5 seconds each at regular intervals. The problem with this data set is that it doesn’t account for the background noises, other people speaking, silence(absence of any speech in certain sections), different intonations, etc.
What I did instead was went through entire audio files, and carefully selected only those snippets where only the subject spoke, with no or minimal background noise and voices, and where the speech was clear and loud enough.
Thankfully I could amplify and normalize the audio files in Audacity itself. So all audio snippets were roughly of the same amplitude.
Next, I plotted the frequency domain audio spectrums for all such snippets (there’s an option to plot audio spectra in Audacity), and cropped out the plot and saved the image. The reason for considering frequency-domain analysis instead of time-domain analysis, because a person’s frequency spectrum is more charecteristic of his natural voice than his/her enunciation.
Also, I noticed that different videos had different EQ’s, and some were high-cut at some frequency, while others were high-cut at yet different frequencies. So, just for the sake of consistency, I only
cropped out the frequency analysis from 0 Hz to 9KHz.
I’m Winston and I created The Bipartisan Press. We label our articles with the political bias, and recently, we came up with the idea of using AI to automate this process and make it more systematic.
I’ve worked with FastAi in the past and so we turned to FastAI to do this, also for it’s simplicity. Using a few tutorials we found on medium and adapting them a little, we were able to tune models like BERT, Roberta, and Albert using FastAI and achieve pretty impressive results.
To sum it up, we used a dataset from Adfontesmedia, trained many different variations and model, and attained the lowest error deviation (MAE) of 6.03, using Roberta.
Thank you to all the various resources on the forum and to Jeremy Howard for his very in depth tutorials and courses.
Let us know what you think and how we can improve!
I know I’ve posted here on the same topic, but I’ve converted my work by using nbdev and published my first pypi package (pip install profetorch). The docs can be found here. Still a long way to go but its an exciting start.
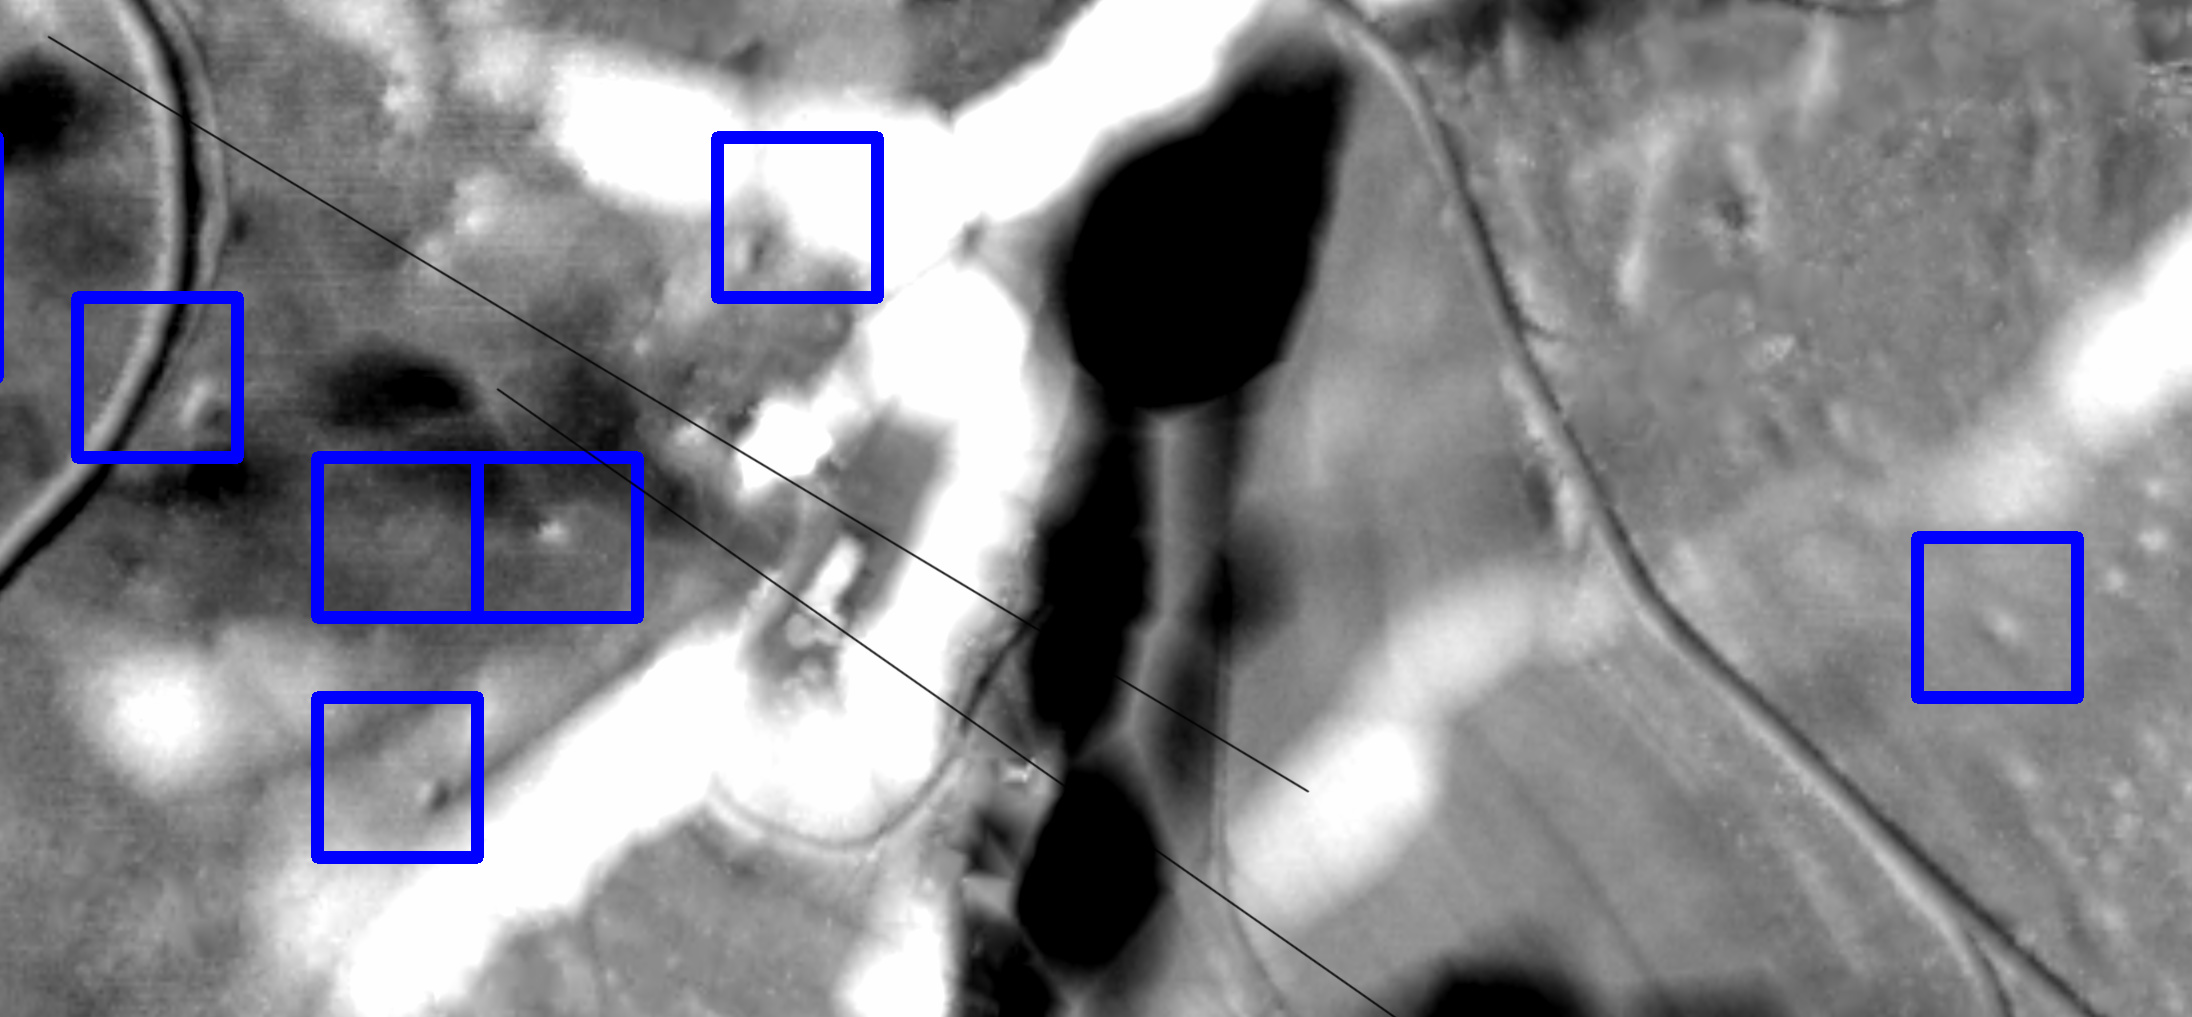
Hi, I thought I share some work I did with Aerial LIDAR images. I am a developer but in this non-profit project I work with archaeologists to discover ancient sites.
As LIDAR can “see” through tree canopy to the ground it facilitated some spectacular finds recently, e.g. ancient Mayan cities hidden in the jungles of Mexico. These cities were big enough to spot them easily, but we are looking into smaller artefacts. For example, the little bumps inside the blue boxes in the image are ancient charcoal kilns. If they were Medieval it is not unlikely that some knight or duke got the iron for his sword from them, or the like…
Here, Deep Learning, and in particular fast.ai allowed us to create a classification model (RESNET34, pre-trained on ImageNet) which recognizes these kilns with around 80 percent accuracy. This is much more than what we had hoped for, because even trained archaeologists achieve 70 to 75 percent only.
There were, however, some domain specific problems which I should mention:
Small datasets: Heritage authorities are notoriously underfunded, so it is usually challenging to get a sample set with, say, a thousand labelled images. To overcome this, we are looking into more data augmentation, e.g. with GAN’s. But your advice is deeply appreciated…
dealing with ambiguity: When labelling a training image (and unlike the cats/dogs example from the course) we often cannot be fully sure what it really shows. So I ended up getting labels like “definitely a kiln” or “most likely a kiln” or “maybe a kiln”. Obtaining the “ground” truth here would mean real digging, and this is prohibitively expensive for hundreds of sites. I could not come up with a satisfying solution for this input data ambiguity, so any ideas would be appreciated. I ended up clustering the “definitely” and “most likely” ones and removing the others from my already painfully small dataset.
We are already preparing for other classes of finds: Celtic fields, ancient road networks and burial mounds are currently our top priority. If you are working in a similar field I would love to hear from you.
I have been working with lesson 3 for a while now. Time well spent on starting to get a grasp on the API data block as well as learning general coding in Python.
Also thank you guys from the online study group for nice discussions and support!
The project is a multi-label classificatier which predicts movie genres based on an image of a movie poster. The following dataset from Kaggle was used: Link to dataset.
However, for fast experimentation and learning purposes I only used 997 out of the total ca 40 000 images in the dataset.
I dont exactly understand what the metric “accuracy tresh” in table below indicates in multi-label classification (if anyone does, I would be more than happy to hear the explanation), but if I understand correctly the accuracy for the predictions is around 88.5% correct on the validation set.
Final Results:
epoch
train_loss
valid_loss
accuracy_thresh
fbeta
time
0
0.164868
0.256826
0.888792
0.521674
00:07
1
0.160248
0.261449
0.883767
0.502454
00:06
2
0.154377
0.260624
0.882674
0.514447
00:06
3
0.146751
0.261764
0.882456
0.516591
00:06
4
0.142635
0.261303
0.884859
0.523274
00:07
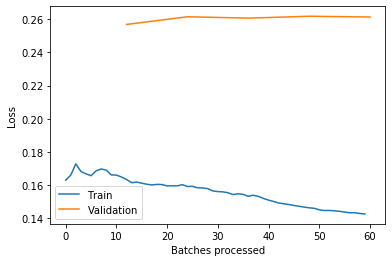
My analysis of the plot of losses:
Training loss is lower than validation loss. The model is leaning more towards overfitting than underfitting (not saying it is overfitting!). To make the model generalize more, adding the rest of the imags in the complete data set to train on is a good idea.
I tried the classifier on a poster of Toy Story, which was not included in my dataset, and got the following result:
This year I worked on HDR imaging using Deep Learning i.e reconstructing HDR images from LDR (Low Dynamic Range / overexposed and underexposed) images using Deep Neural Networks and we were able to get state-of-the-art results.


 Thank you!
 ]
]