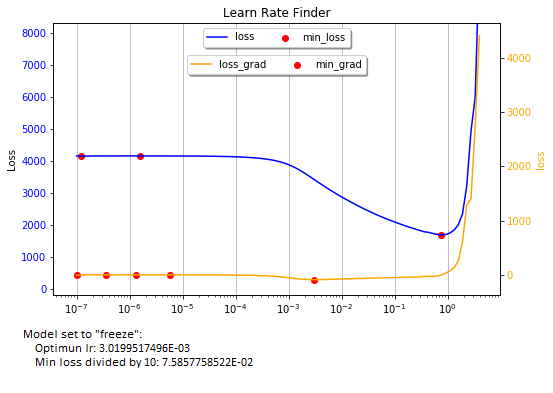
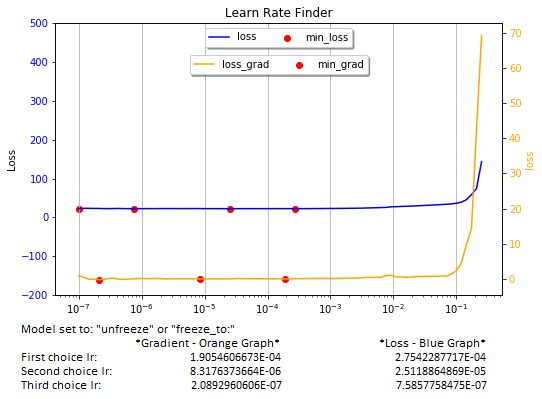
The recorder.plot function is very useful when training a model that is set to “freeze”. However, when set to “unfreeze” or “freeze_to”, the graph flattens and selecting an adequate learning rate becomes more of an art.
In the method shown below, I have tried to exploit the data supplied by the lr_learn function to rationalize the selection of lr values. As the starting point, I use the loss and lrs vectors supplied by lr_learn.
I use scipy.signal argrelextrema function to calculate min and max values for the loss and loss gradient columns and to filter the noise (sharp spikes) in them, retaining only the points of inflection. The “noise” parameter controls the noise filtering level. My tests show that n=3 works fine. Higher values filter data more aggressively.
The data is collected in a DataFrame and plotted in the familiar loss vs lr graphs.
The method automatically detects the “freeze”, “freeze_to”, and “unfreeze” states of the model to display inflection point values.
Mode of Use
You can select inflection points from both the loss (blue) and the loss-gradient (yellow) graphs. Work from right to left, but Ignore the global min point at the bottom of the bowl when the model is set to “freeze”. Also, ignore any point that is too close (less than 1e-1) to the sharp upturn of the graph on the right. They will not work well in training your model. If you are using a slice, choose carefully the start and end inflection points.
As a convenience, the method prints the three best lr values in each graph. Important: don’t blindly rely on the printed lr values. The graphs are what counts. If I learned anything working in AI, is that it is not a “plug-and-play” world.
The method contains several parameters. “learner” Is mandatory. All others can be ignored, as they are useful only for research.
Hope this method will be of value to users of the fine FASTAI library. Improvements are welcome.
I would appreciate receiving comments on the efficacy of this tool, and suggestions on how to improve it. Thanks.
def is_unfreeze(learner):
   '''
   Determines whether the next-to-last layer in the model is set to unfreeze or freeze
   '''
   c = 0
   for each in list(learner.model.body[-1][0].parameters()):
     if each.requires_grad: c += 1
   if c == len(list(learner.model.body[-1][0].parameters())):
     return True
   else:
     return False


def find_optimal_lr(learner, noise=3, show_df=None, show_min_values=False):
     '''
    Parameters

    learner:  The learner (mandatory)

    (Optional)
    noise:   Filtering parameter, set to 3. Suggest no to modify this value

    show_df: 'head' - Show the top 50 rows,
                    'tail' - Show the tail 50 rows

    show_min_values: True  - Display all values, min, and max
                   False - Display min_loss and max_grad values

   Returns:
     optimun_lr - if freeze = True
     Suggested Best Slice - if freeze = False

   Author:  J. Adolfo Villalobos @ 2019. wolves.lair@icloud.com
   '''

   # Get loss values, corresponding gradients, and lr values from model.recorder
   loss = np.array(learner.recorder.losses)
   loss_grad = np.gradient(loss)
   # Transform lrs list to np array
   lrs = np.array(learner.recorder.lrs, dtype='float32')

   # Create a DataFrame with the data
   data = {'loss': loss.T, 'loss_grad': loss_grad.T, 'lrs': lrs.T}
   df = pd.DataFrame(data, columns=['loss', 'loss_grad', 'lrs', 'min_loss', 'max_loss', 'min_grad', 'max_grad'])

   # Populate "min" and "max" columns for loss and gradient values filtering the noise with argrelextrema.
   from scipy.signal import argrelextrema

   #********
   # IMPORTANT: n filters noise (sharp spikes in the data). Higher n value filters noise more aggressively.
   # n = 3 seems to work best
   n=noise
   #********

   df.min_loss = df.iloc[argrelextrema(df.loss.values, np.less_equal, order=n)[0]]['loss']
   df.max_loss = df.iloc[argrelextrema(df.loss.values, np.greater_equal, order=n)[0]]['loss']
   df.min_grad = df.iloc[argrelextrema(df.loss_grad.values, np.less_equal, order=n)[0]]['loss_grad']
   df.max_grad = df.iloc[argrelextrema(df.loss_grad.values, np.greater_equal, order=n)[0]]['loss_grad']

   # Optional: Display dataframe if show_df=True
   if show_df == 'head': print(df.head(50))
   elif show_df == 'tail': print(df.tail(50))

   # Plot losses and loss gradients against lr values
   plt.figure(figsize=[8, 5])
   #figs, ax = plt.subplots(1,1)
   ax = plt.gca()
   color_loss = 'blue'
   color_grad = 'orange'
   color_green = 'green'
   color_red = 'red'

   ax.xaxis.grid(True)
   ax.set_ylabel('Loss')
   ax.set_title('Learn Rate Finder')
   ax.tick_params(axis='y', labelcolor=color_loss)
   ax.semilogx(df.lrs, df.loss, c=color_loss, label='loss')

   # Define variable vertical size of the plot window, depending on the graph shape
   u_limit = max(df.loss.loc[(df.lrs < 0.1)].max(), 250)*2
   ax.set_ylim([-200, u_limit])

   # Plot resulting line graphs
   ax2 = ax.twinx()
   ax2.set_ylabel('loss', color= color_grad)
   ax2.semilogx(df.lrs, df.loss_grad, c = color_grad, label='loss_grad')
   ax2.tick_params(axis='y', labelcolor = color_grad)

   # plot inflection points
   ax.scatter(df.lrs, df.min_loss, c = color_red, label='min_loss')
   ax2.scatter(df.lrs, df.min_grad, c = color_red, label='min_grad')
   if show_min_values:
     ax.scatter(df.lrs, df.max_loss, c = color_green, label='max_loss')
     ax2.scatter(df.lrs, df.max_grad, c = color_green, label='max_grad')

   # Legends
   plt.LogFormatter(labelOnlyBase=False)
   ax.legend(loc='upper center', bbox_to_anchor=(0.5, 1.0), ncol=3, fancybox=True, shadow=True)
   ax2.legend(loc='upper center', bbox_to_anchor=(0.5, 0.9), ncol=3, fancybox=True, shadow=True)
   plt.show()

   # Display resulting lr values, format varies depending of te state of the model's next-to-last layer ggroup: set to freeze or unfreeze
   if is_unfreeze(learner):
     # Yellow min_grad graph
     rev_tru_idx = df.min_grad.notna()[::-1]
     optimun_lr_upper_bound_g = df.lrs.iloc[rev_tru_idx.idxmax()]
     rev_tru_idx[rev_tru_idx.idxmax()] = np.NaN
     optimun_lr_lower_bound_1_g = df.lrs.iloc[rev_tru_idx.idxmax()]
     rev_tru_idx[rev_tru_idx.idxmax()] = np.NaN
     optimun_lr_lower_bound_2_g = df.lrs.iloc[rev_tru_idx.idxmax()]

     # Blue lass graph
     rev_tru_idx_loss = df.min_loss.notna()[::-1]
     optimun_lr_upper_bound_l = df.lrs.iloc[rev_tru_idx_loss.idxmax()]
     rev_tru_idx_loss[rev_tru_idx_loss.idxmax()] = np.NaN
     optimun_lr_lower_bound_1_l = df.lrs.iloc[rev_tru_idx_loss.idxmax()]
     rev_tru_idx_loss[rev_tru_idx_loss.idxmax()] = np.NaN
     optimun_lr_lower_bound_2_l = df.lrs.iloc[rev_tru_idx_loss.idxmax()]

     # Print results and return choices of lr slice
     print('Model set to: "unfreeze" or "freeze_to:"')
     data = {'*Gradient - Orange Graph*' : [optimun_lr_upper_bound_g, optimun_lr_lower_bound_1_g, optimun_lr_lower_bound_2_g],
          '*Loss - Blue Graph*' : [optimun_lr_upper_bound_l, optimun_lr_lower_bound_1_l, optimun_lr_lower_bound_2_l]}
     prdf = pd.DataFrame(data, index = ['First choice lr:', 'Second choice lr:', 'Third choice lr:' ])
     pd.options.display.float_format = '{:.10E}'.format

     print(prdf)

     return optimun_lr_lower_bound_1_g, optimun_lr_upper_bound_g

   else:

     optimun_lr_upper_bound = df.lrs.iloc[df.min_grad.notna()[::-1].idxmax()]
     optimun_lr_lower_bound = df.lrs.iloc[df.min_loss.notna()[::-1].idxmax()]/10
     # Print results and return optimal lr
     print('Model set to "freeze":')
     print('  Optimun lr: {:.10E} '.format(optimun_lr_upper_bound))
     print('  Min loss divided by 10: {:.10E}'.format(optimun_lr_lower_bound))
     return optimun_lr_upper_bound