Hello! I’m trying to write a tutorial blog post about an amazing geospatial package I recently came across. It is called geemap(https://github.com/giswqs/geemap). I decided to use fast pages because it is such an awesome looking framework and the story telling capabilities seem amazing because of interactive plotting. However, I tried running a jupyter notebook it locally(which ran successfully along with an interactive plot), but when I uploaded the notebook to my blog repo, the visualization did not render. Any insight as to why that is the case?
Thanks for the help in advance
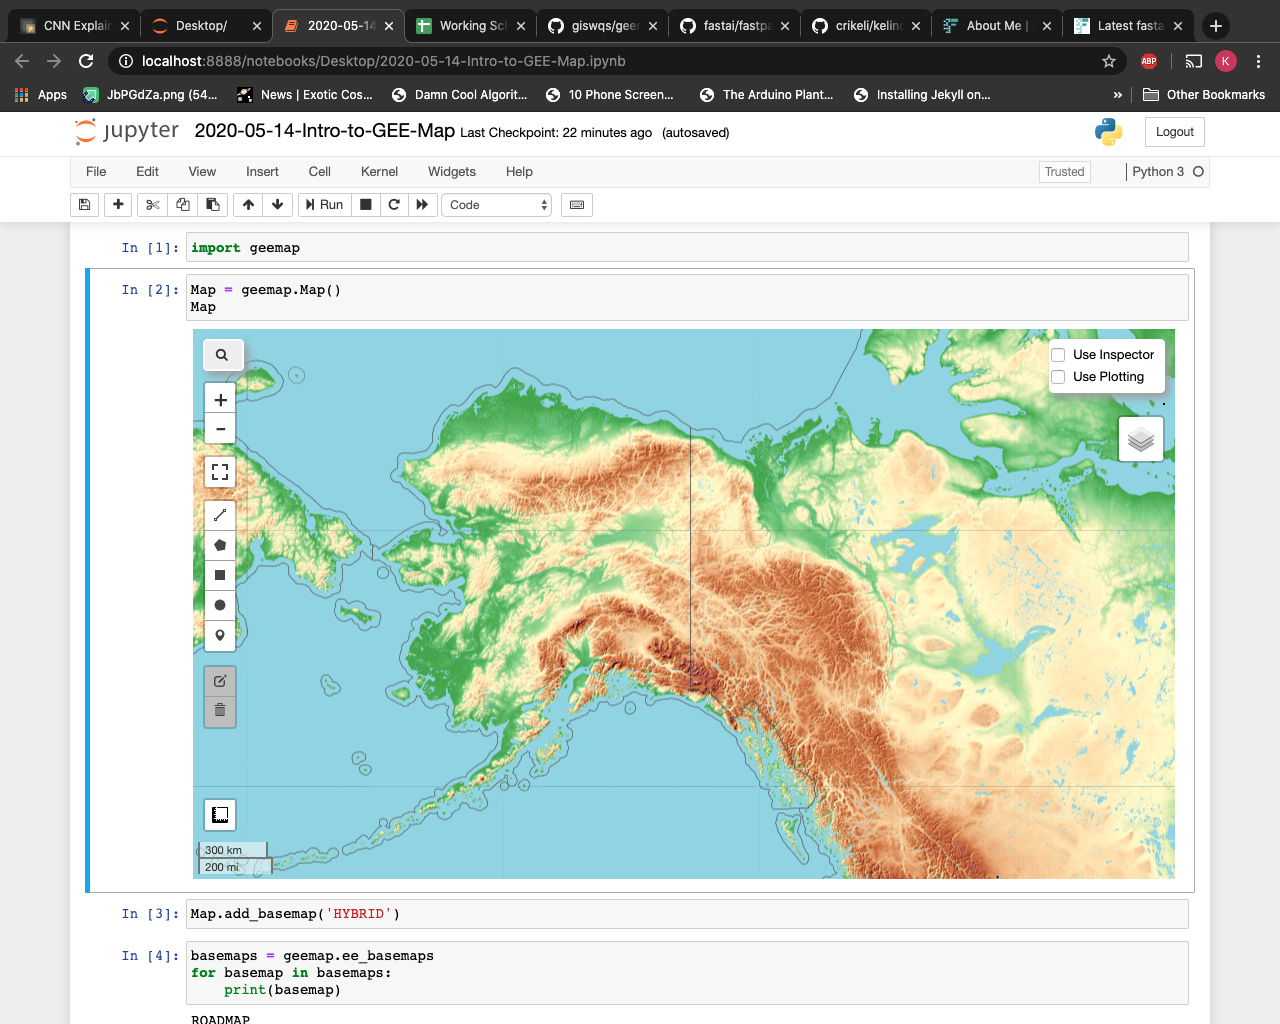
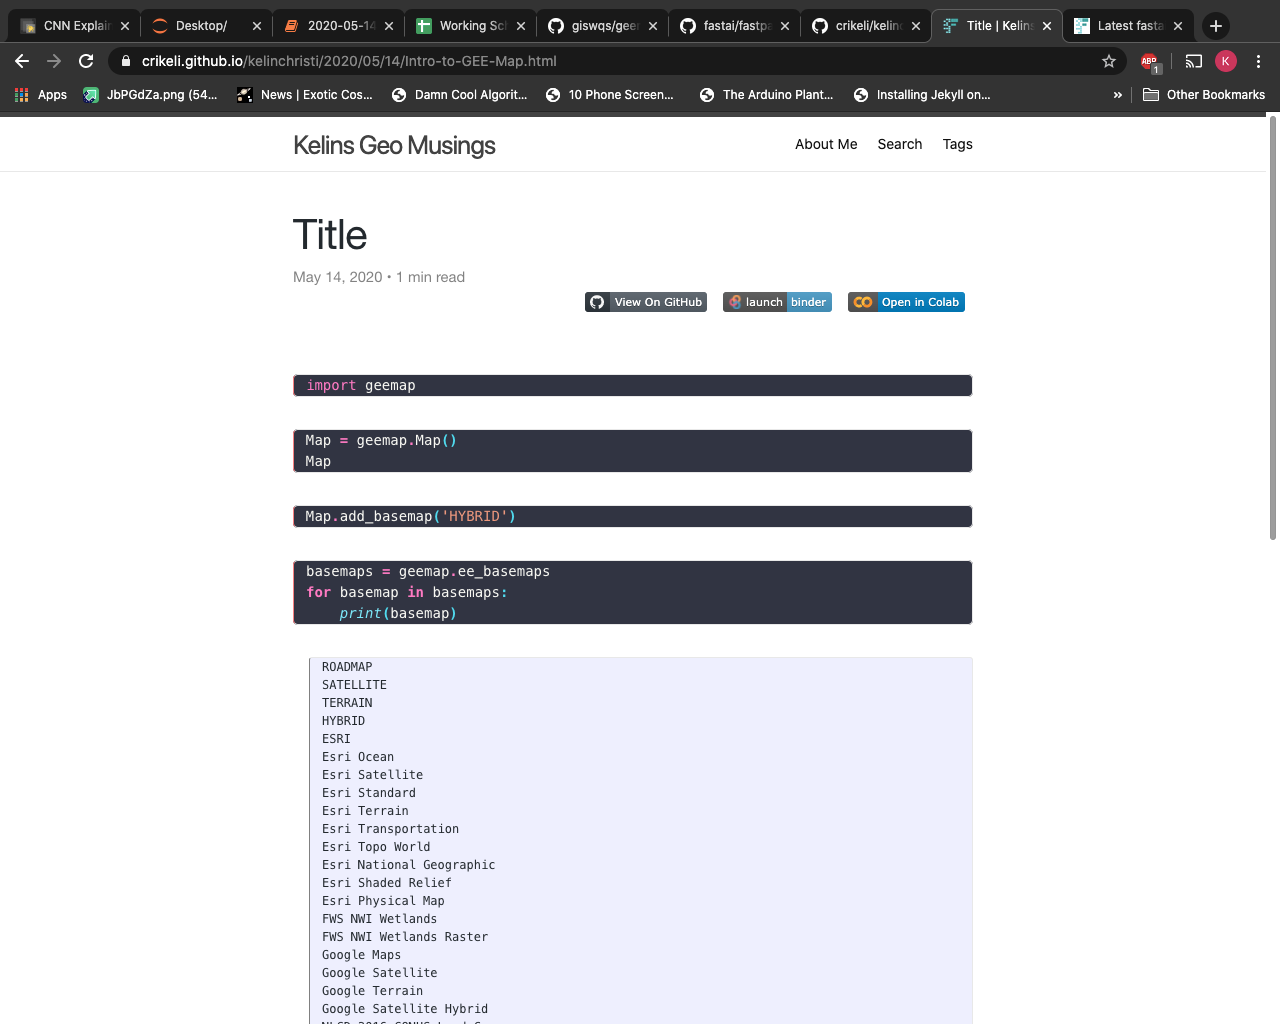
I’ve attached a couple of screen shots below (The first one is the local version, the second is the published on the blog)
There are limitations of what kind of interactive charts can run on GitHub pages because it doesn’t have a backend and is ultimately a static site.
Not all interactive charting libraries will work out of the box like this, without adding additional javascript etc to the page. You will have to debug that as each library is different. It just so happened that Altair worked without any additional configuration.
The best advice I can give is to follow the TroubleShooting Guide especially the part about local development and looking at your browser’s developer console for errors and troubleshooting from there
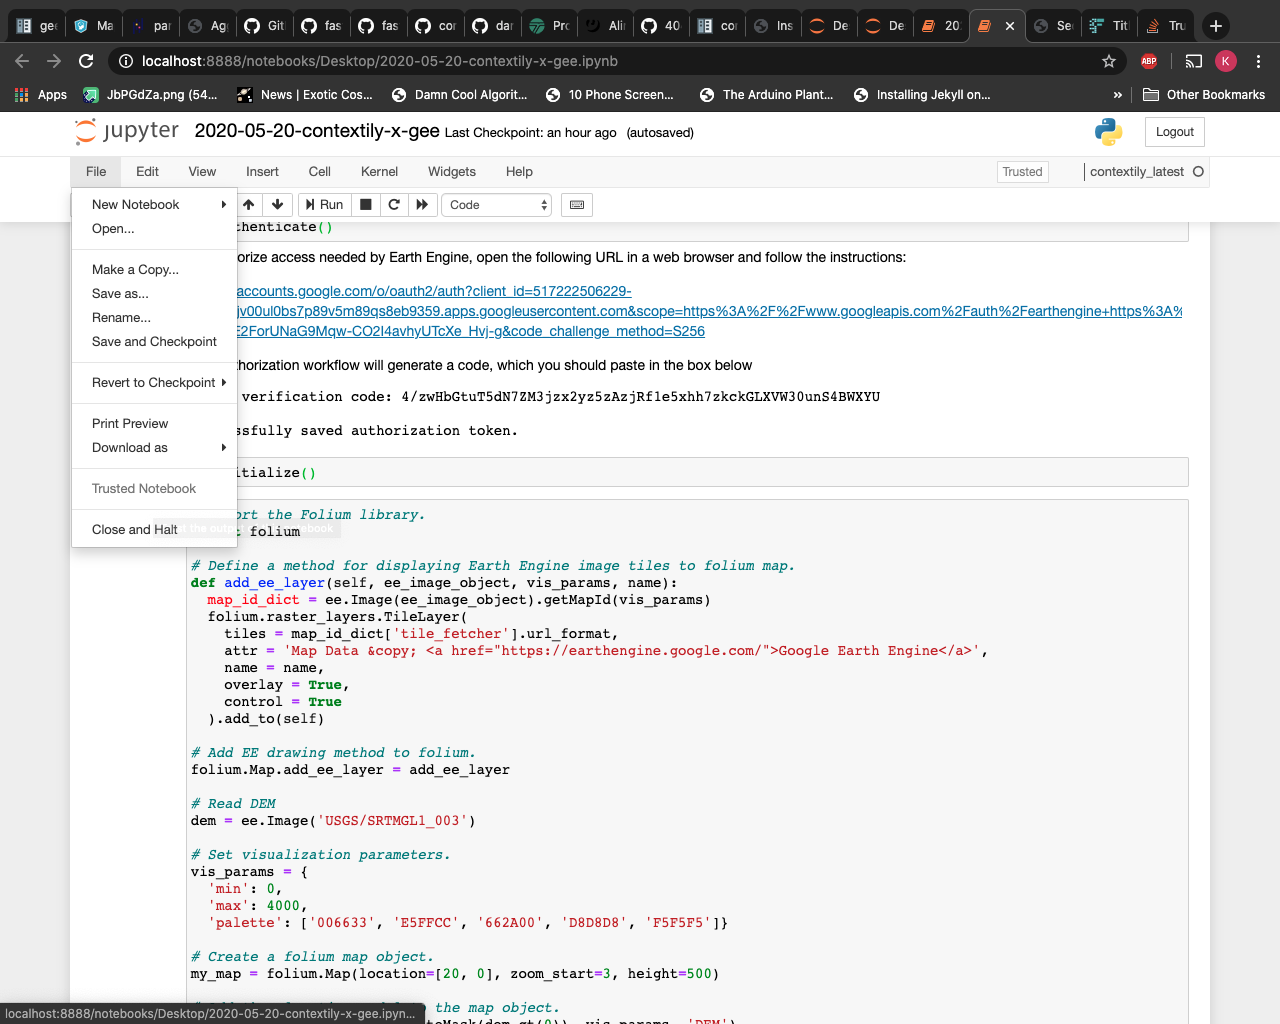
thanks for your response. I did some troubleshooting, and as it turns out, the error I received is: Make this Notebook Trusted to load map: File -> Trust Notebook
When I ran the notebook locally, I went onto the file tab, to look for the ‘Trust Notebook’ option, and it was already trusted(see attached image) any thoughts on how I can change that feature as I’m locally running fastpages?
Please, I would like some guidelines, I am trying to understand how i can perform Object Extraction from satellite Imagery and yet I don’t where to start. Please, I would like some guidelines to extract specific information from object detected from the satellite imagery.