In my code, first I change the default callbacks
defaults.callbacks[1] = Recorder(train_metrics=True)
defaults.callbacks
to let fastai also plot ‘train metrics’ during training,
here is my Learner:
learn = Learner(
dls=dls,
model=model,
loss_func=loss_func,
splitter=my_nn_splitter,
metrics=[
    accuracy,
    RocAucBinary(),
    Recall(),
    Precision(),
],
wd_bn_bias=True,
cbs=[
    MixUp(),
    DataBalanceCallback(),
],
)
learn.to_fp16()
learn.summary()
learn.show_training_loop()
and everything works during fir_one_cycle()
learn.fit_one_cycle(
    n_epoch=args.epoch,
    lr_max=args.lr,
    wd=args.wd,
    cbs=SaveModelCallback(
        monitor='valid_loss',
        fname='stage1-bestmodel',
        with_opt=False,
    ),
)
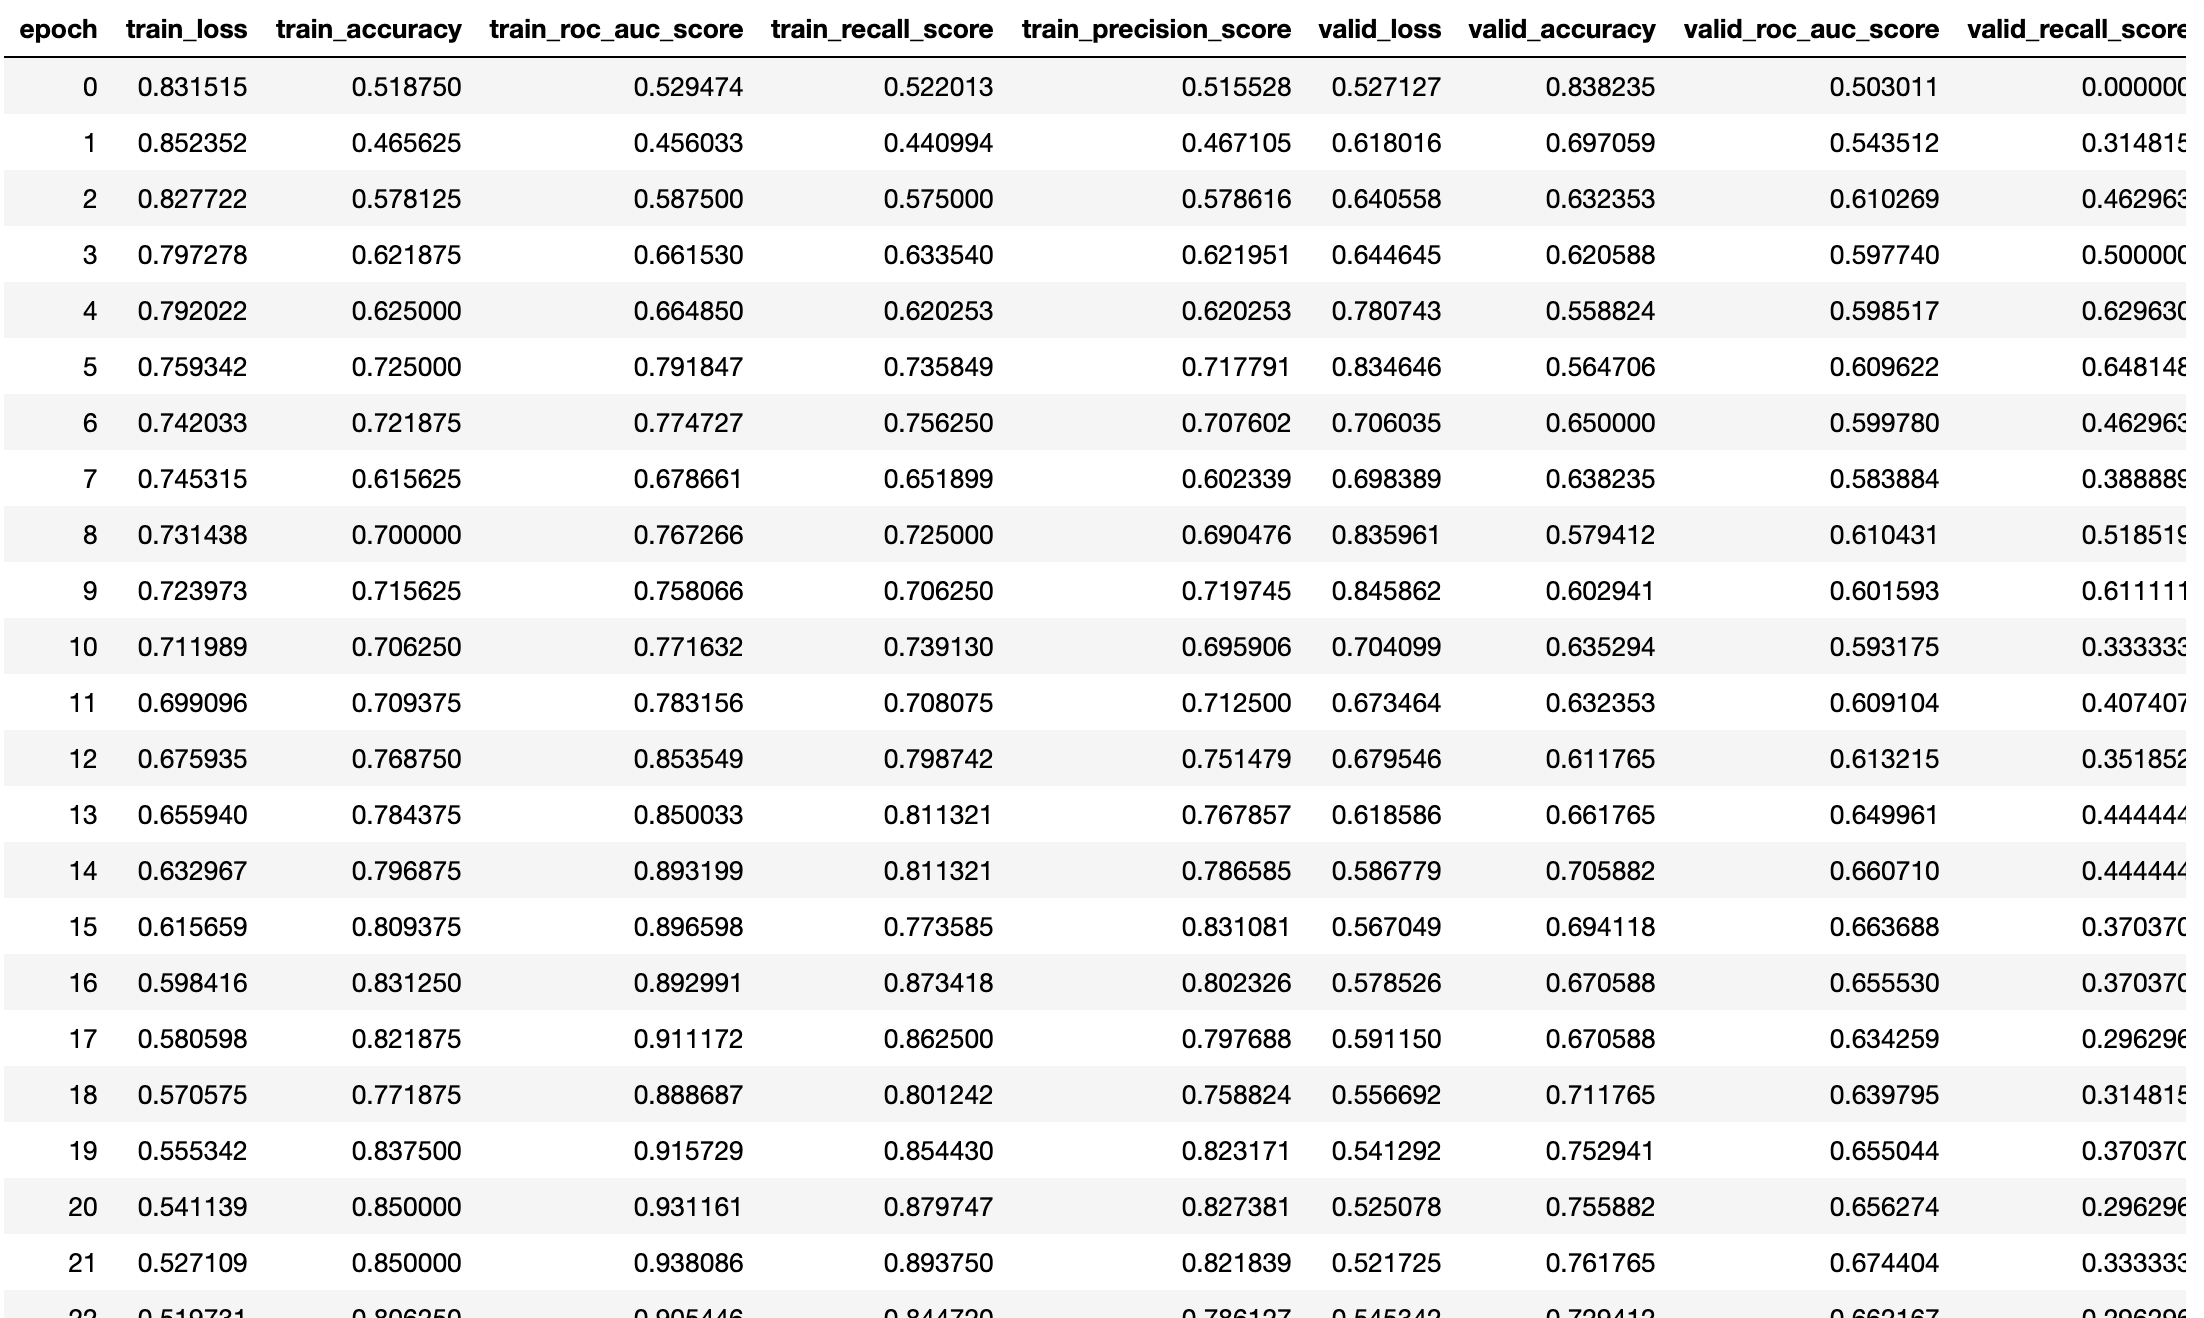
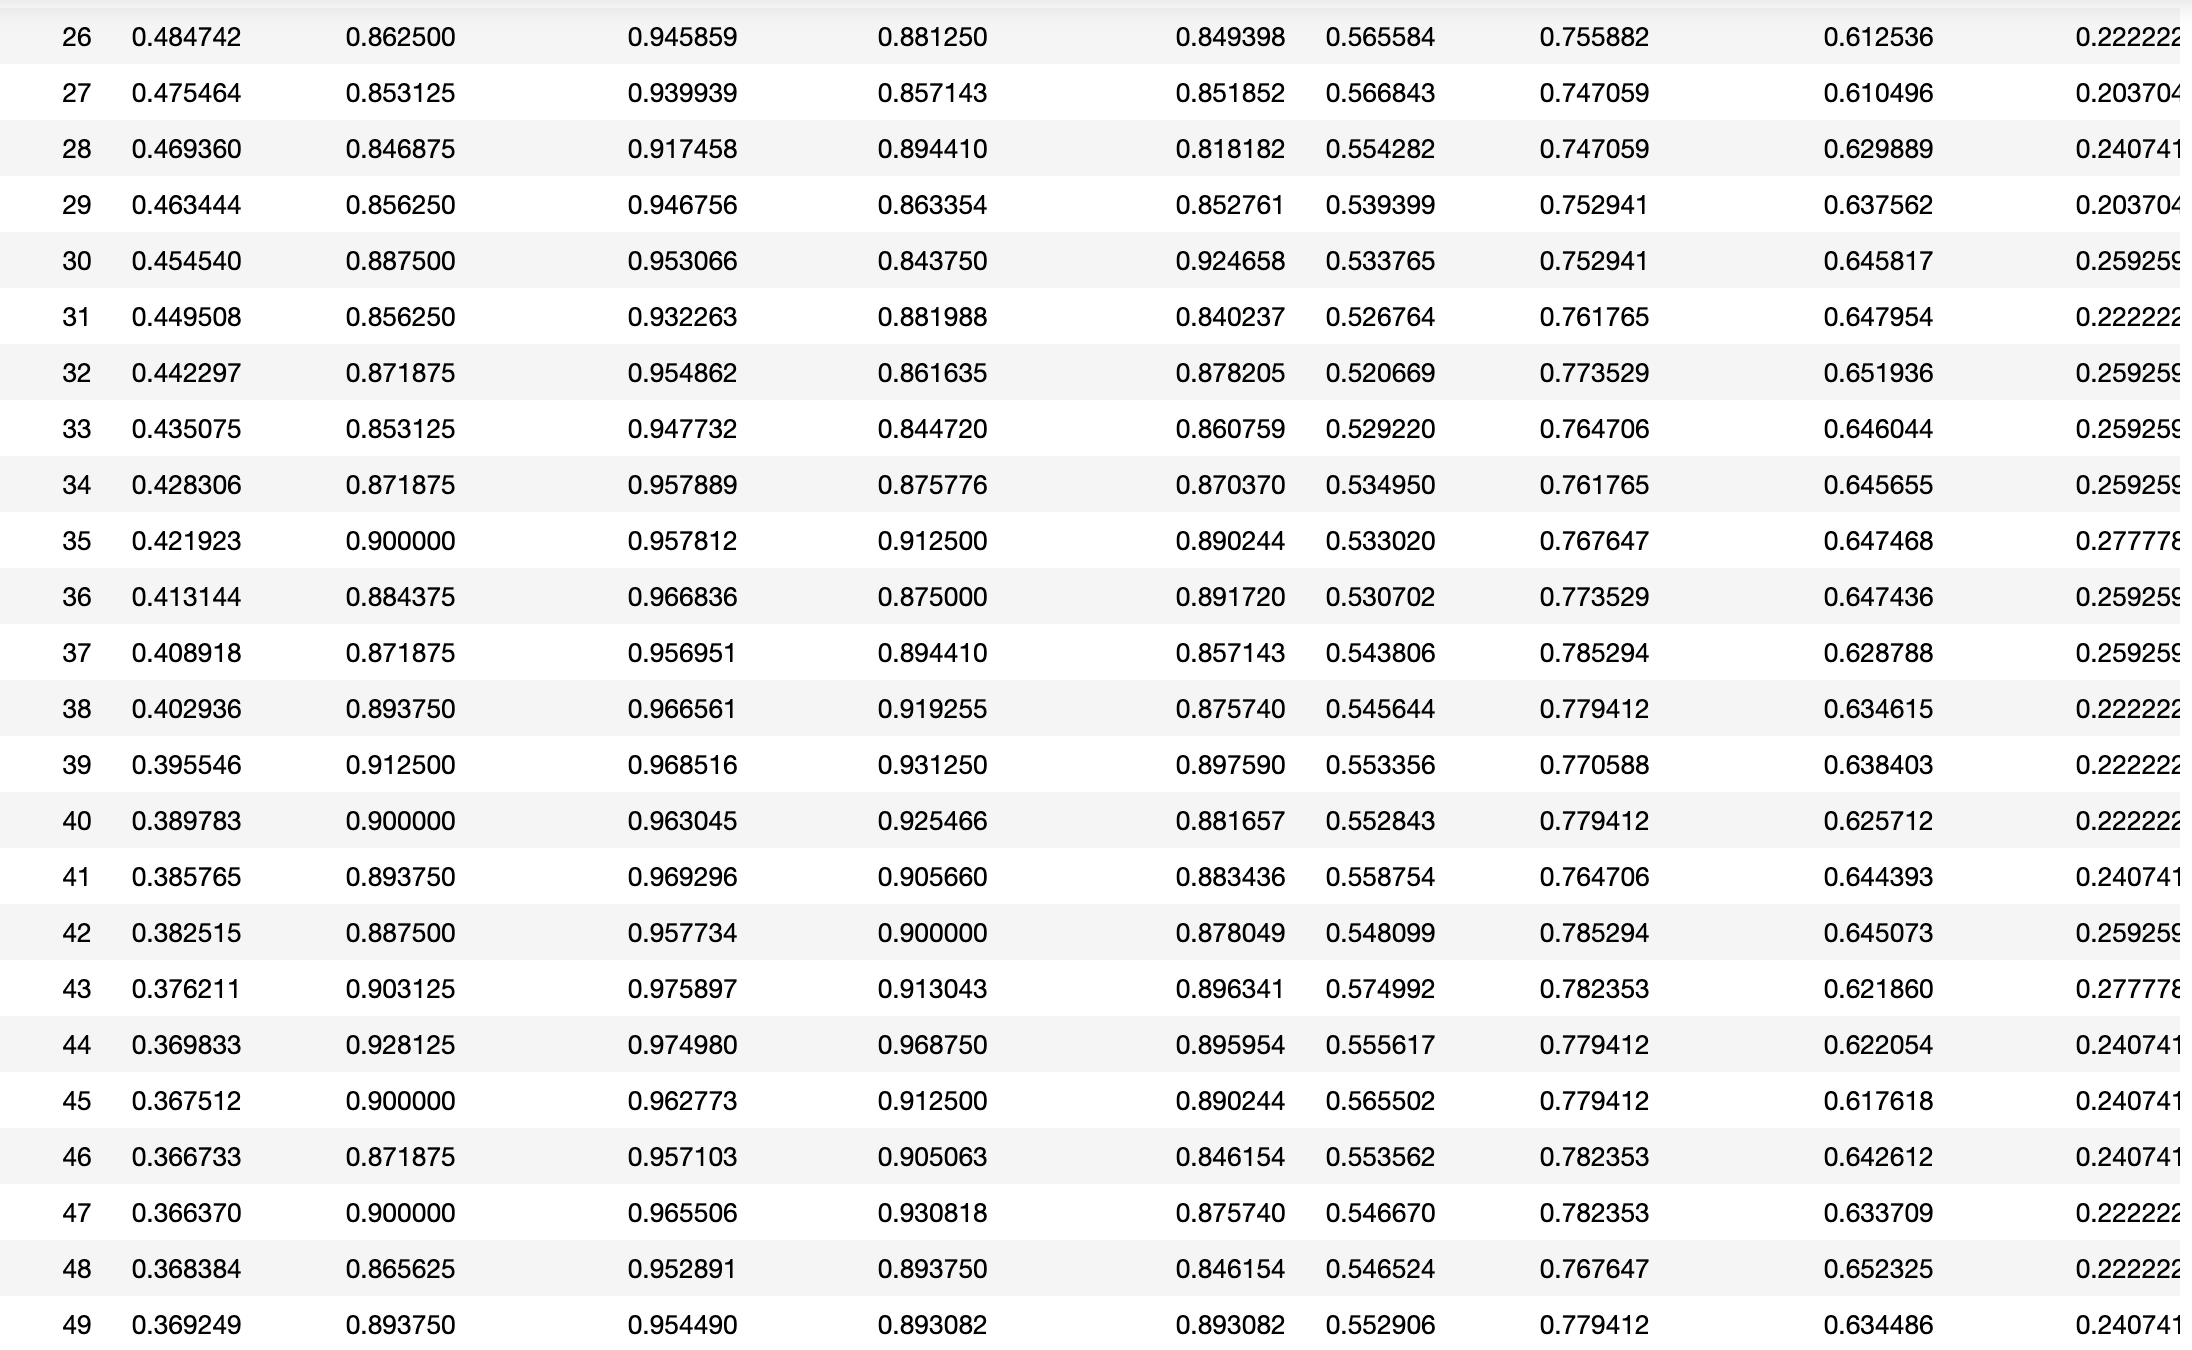
here is the training process
then I run
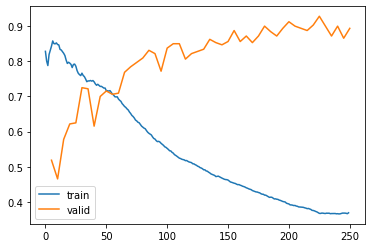
learn.recorder.plot_loss(skip_start=0, with_valid=True)
I got a wrong losses images, because the valid loss is appparently not the values got during my training process. Valid loss should decrease in the second half of process but it didn’t
Why that happened? Is there something wrong in my code?