I am trying to print the train and validation losses of multiple fast-ai Learner objects on one graph.
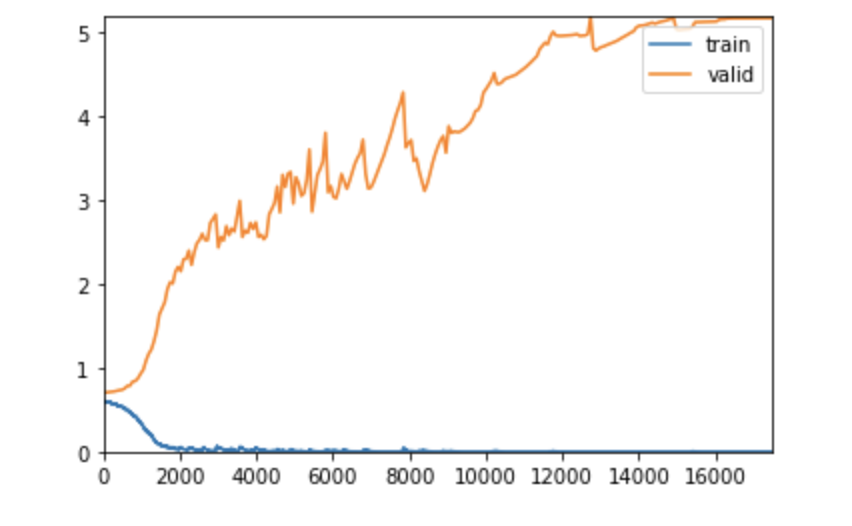
Currently, the cbs=ShowGraphCallback() works for each Learner object individually.
However, if I have two Learner objects with two different models, am I able to generate one plot consisting of train and validation losses for each model?
from fastai.text.all import *
learn = Learner(dls, model.cuda(), loss_func=nn.CrossEntropyLoss(), metrics=[accuracy])
EPOCHS = 250
OPTIMAL_LEARNING_RATE = 9.120108734350652e-05

learn.fit_one_cycle(EPOCHS, OPTIMAL_LEARNING_RATE,cbs=ShowGraphCallback())