rohit_gr
December 8, 2018, 11:01pm
1
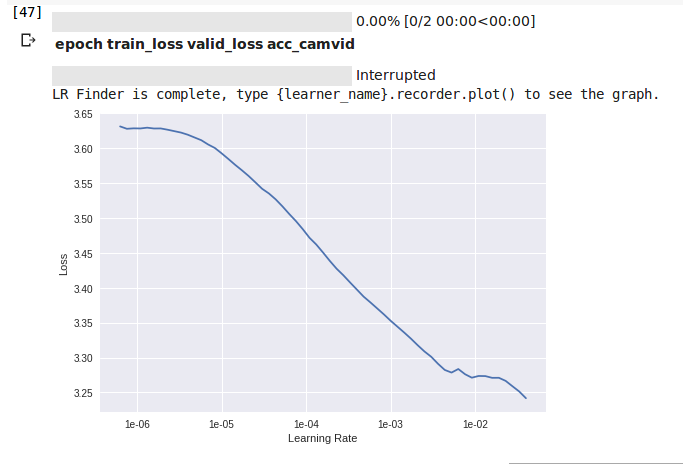
I was working with the lesson-3-camvid notebook from course-v3 GitHub, but the lr_find(learn) is not generating the required plot.
name2id = {v:k for k,v in enumerate(codes)}
void_code = name2id['Void']

def acc_camvid(inp, target):
    target = target.squeeze(1)
    mask = target != void_code
    return (inp.argmax(dim=1)[mask]==target[mask]).float().mean()

metrics=acc_camvid
wd=1e-2
learn = unet_learner(data, models.resnet34, metrics=metrics, wd=wd)
lr_find(learn)
learn.recorder.plot()
1 Like
xvtongye
March 20, 2019, 9:23am
2
I got the same plot. And after that, which lr do you use?
rohit_gr
March 20, 2019, 10:39am
3
I don’t remember actually, but as far as I can remember I updated start_lr to something around 1e-5 in lr_find().
What do you mean by “not the required plot”? It does roughly look like the graph in the video lesson (just after the call to learn.create_unet), although the range for the loss there is between 2.7 and 3.4. But the overall shape is “correct”, or is it not?
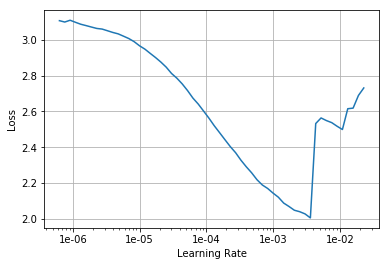
I have yet a slightly different result, see image below. My range for loss is from 2.0 to 3.0.
Possible reasons for this difference:
I used data from the SegNet repository rather than via untar_data(URLs.CAMVID) as in the video lesson ;
I did not specify size in the transform step, and I am not sure what Jeremy exactly did in his run before showing his results in class.
 camvid-learn-recorder-plot