Hey guys!
So after hearing the first lesson, I tried to replicate the code given. Herefore I use colab.
After training the model I displayed the top losses with the interp.plot_top_losses(9, figsize=(15,11)) command. Yet the images looked as follows:

Dubble checking if the images looked like in the lesson before I accepted the mystery. Yet, I set up my own data training set and noticed the same discolouring.
Since I didn’t change any code from the lesson1 notebook I won’t upload the code here again.
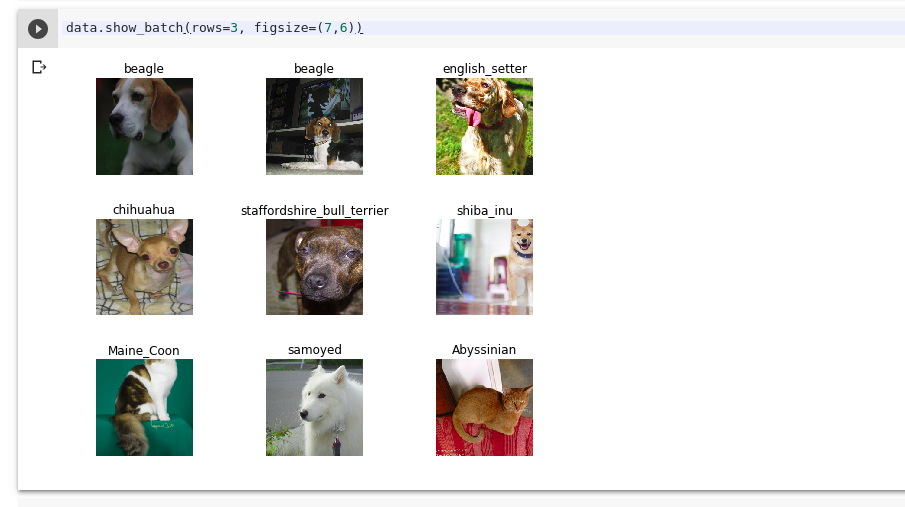
Can someone offer a tip, as to why this is happening? The learning rate etc. was not influenced by this. Also the images looked normal when I run the data.show_batch(rows=3, figsize=(7,8)) command after the training:
Thanks in advance for your help!
Kind regards.
