After upgrading to 1.0.40.dev0 from 1.0.39 something broke in my tabular learner.
The code works well on 1.0.39. But when launching it on 1.0.40.dev0, the following happens:
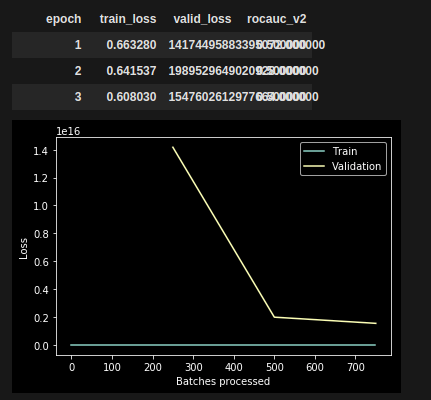
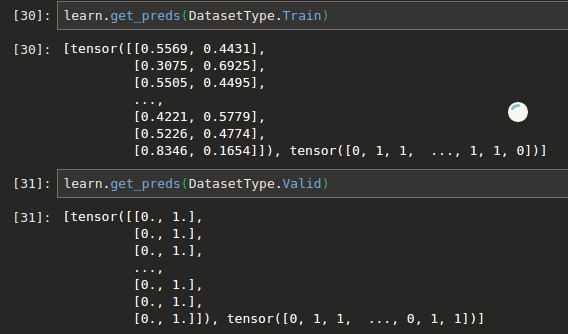
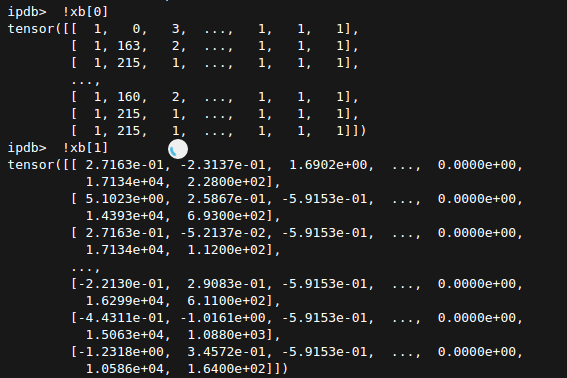
- train loss is calculated just fine, predictions seem reasonable
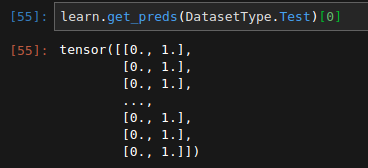
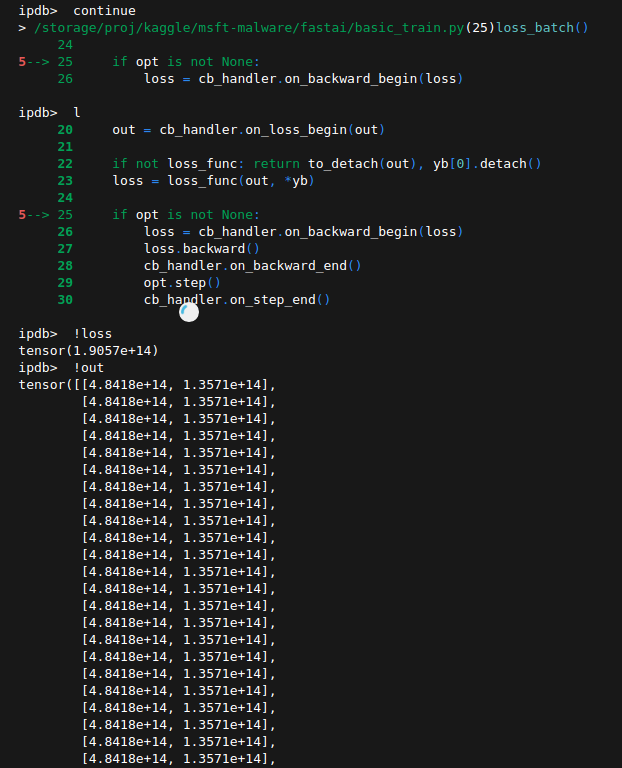
- validation loss explodes into millions. All predictions default to
1
I am having a hard time thinking of a hypothesis here.
Since Train and Validation come from the same dataframe, and predicted probs ALL become 1, while preds on train seem normal, I suspect there is some error with the library.
But at the same time, the tabular.ipynb example form github works just fine. So it must be something about my code/dataset that could cause this problem.
valid_idx = sorted(df.sample(frac=0.2, random_state=SEED).index)
test = TabularList.from_df(chunk.copy(), path='.', cat_names=cat_names, cont_names=cont_names)

src = TabularList.from_df(df.copy(), path='.', cat_names=cat_names, cont_names=cont_names, procs=procs) \
                           .split_by_idx(valid_idx) \
                           .label_from_df(cols=dep_var) \
                           .add_test(test)

original_data = src.databunch()

learn = tabular_learner(original_data, layers=[300, 100, 50], emb_szs=emb_szs, metrics=[rocauc_v2()], ps=[0.3, 0.3, 0.1], emb_drop=0.3)

learn.lr_find()
learn.recorder.plot()
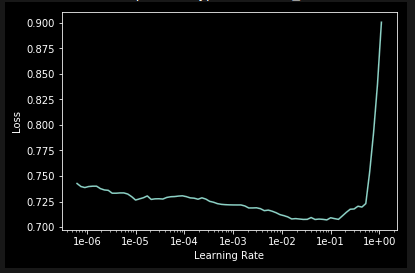
LR = 1e-03
learn.data.batch_size = 64

learn.fit_one_cycle(cyc_len=3, max_lr = LR)
learn.recorder.plot_losses()