I have trained my model to perform image segmentation and used show_results() to verify that it’s working correctly. However, when I use learn.predict() on an image, it gives me multiple tensors instead of a simple .png file that I want. How can I export the prediction result so that it looks just like the pictures shown by show_results()? I am using fastai 2.5.6 for this.
Hi @AleksanderK,
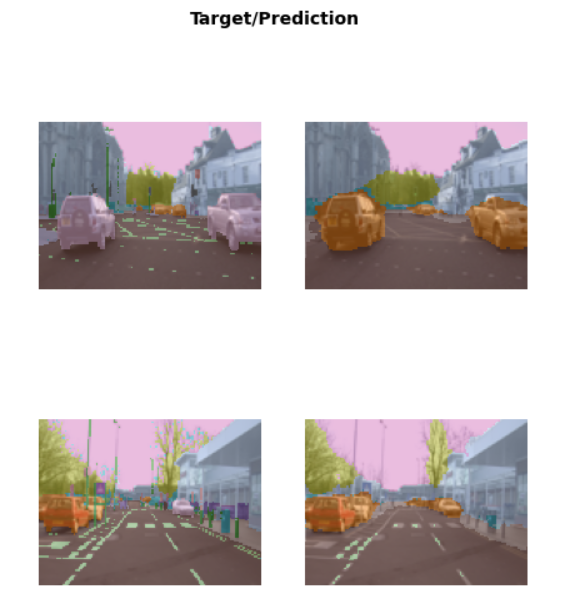
Right now I am working on a segmentation dataset, and I generate overlay as follows:
from pathlib import Path
from typing import Optional

import PIL.Image
import numpy as np
from matplotlib import pyplot as plt
from skimage import color
from skimage import transform
from fastai.data.transforms import get_image_files


def mask_overlay(image_file: str, mask_file: str, mask_alpha: float = 0.5) -> PIL.Image:
    """Overlay a mask on top of an image."""

    img, seg = [np.asarray(PIL.Image.open(fn)) for fn in (image_file, mask_file)]  # type: ignore

    img = np.amax(img) - img

    return color.label2rgb(seg, img, kind="overlay", alpha=mask_alpha)


def preview_segmentation_data(
    dirname: Path,
    n_rows: int = 3,
    n_cols: int = 3,
    figsize_mult: int = 4,
    mask_alpha: float = 0.5,
    resize: Optional[int] = None
) -> None:
    files_images = {fn.stem: fn for fn in get_image_files(dirname/"images")}
    files_masks = {fn.stem: fn for fn in get_image_files(dirname/"masks")}
    keys = list(files_images)

    n_total = len(files_images)
    n_sampled = min(n_total, n_rows * n_cols)
    idx = np.random.choice(n_total, n_sampled, replace=False)

    f, axes = plt.subplots(
        n_rows, n_cols,
        figsize=(n_cols * figsize_mult, n_rows * figsize_mult)
    )

    for i, ax in enumerate(axes.flat):
        x, y = files_images[keys[idx[i]]], files_masks[keys[idx[i]]]
        overlay = mask_overlay(x, y, mask_alpha=mask_alpha)
        if resize is not None:
            overlay = transform.resize(overlay, (resize, resize))
        ax.imshow(overlay)
        ax.set_axis_off()

    f.patch.set_facecolor('black')

    plt.subplots_adjust(wspace=0, hspace=0)
So, essentially, you can use skimage.color.label2rgb to transform a segmentation mask and a sample into a single image.
You can make a step forward and use something similar to overlay samples and predictions. For this purpose, you only need to transform the predicted tensors into numpy arrays, and also make sure that both image and predicted mask have the same size. (In case if your forecasted mask is smaller than the “raw” input image.)
Also, I guess that it should be possible to somehow access the plt.Figure object displayed in the Jupyter. Maybe via plt.gcf? Then you can save the whole canvas or separate axes as image files.