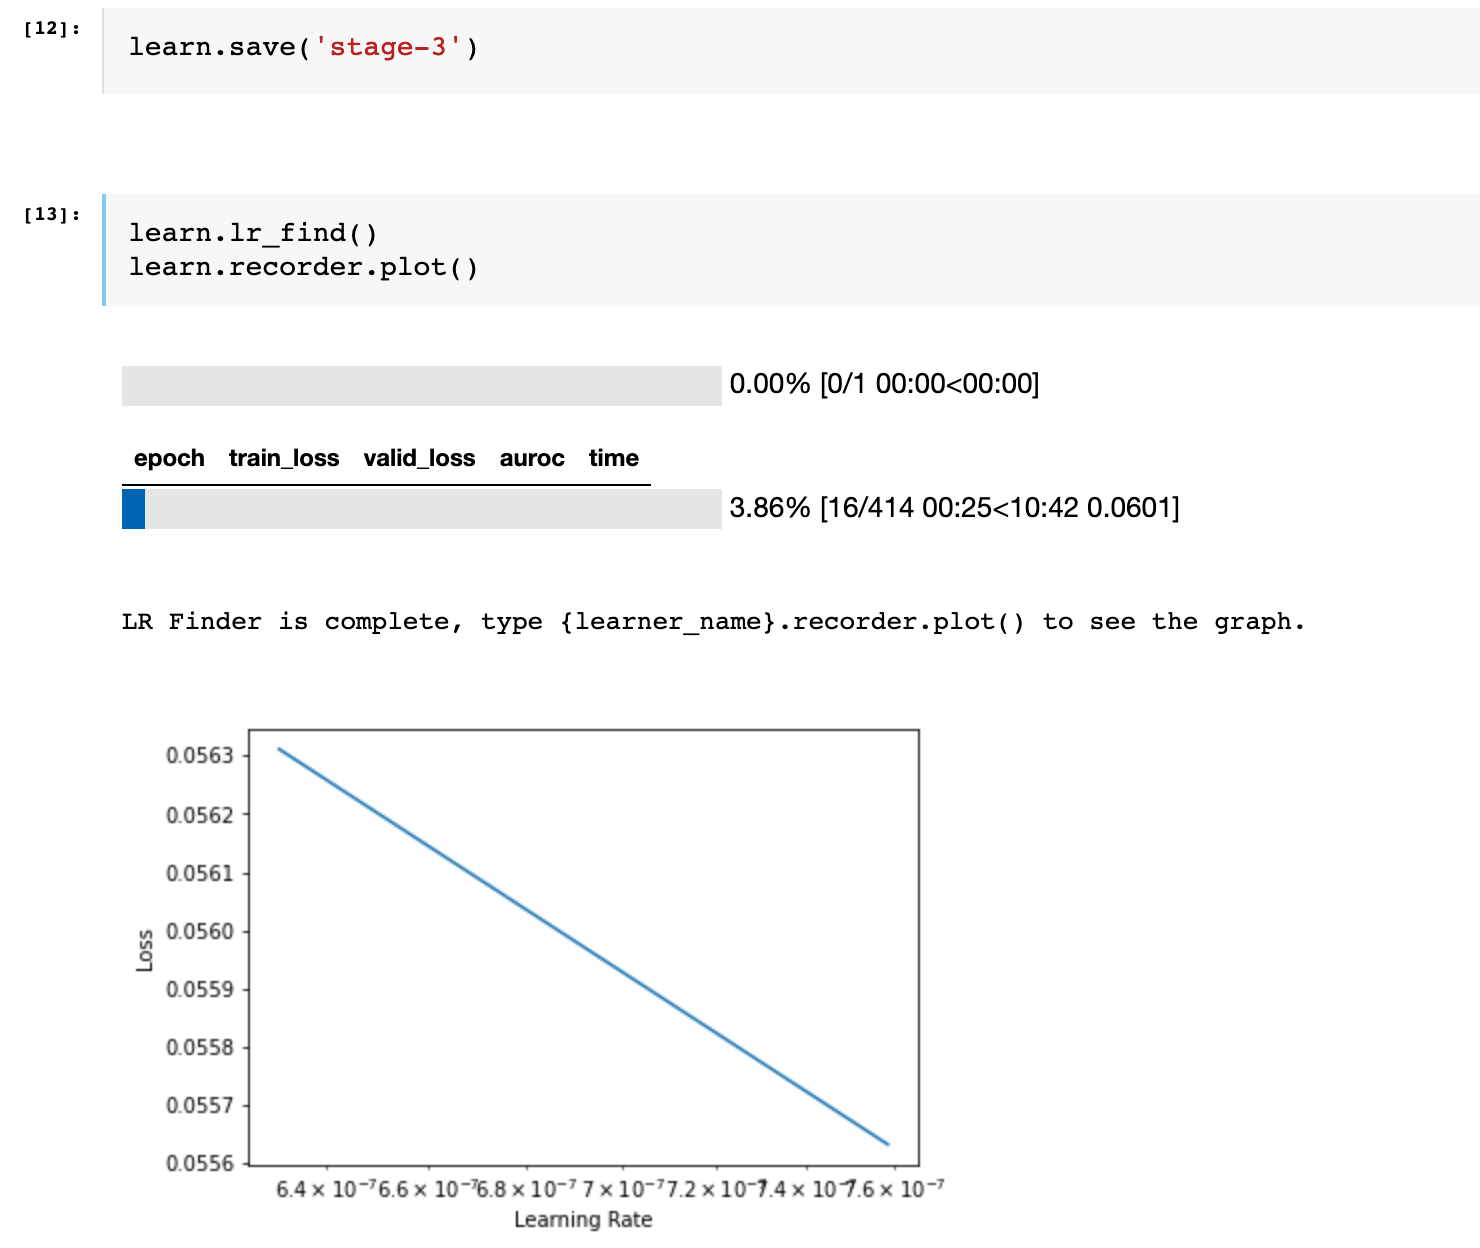
What does this graph tell me? Keep in mind the metric I’m trying to increase is AUROC, not accuracy and I’ve been struggling on how to make it pass 90 from the current score of 89.7.
What jumps out to me is that the learning rate has such a small range. The default range is already much larger, so the only reason I can think of it stopping is something to do with the stop_div value. Maybe try setting it to false and lower the number of iterations to test?