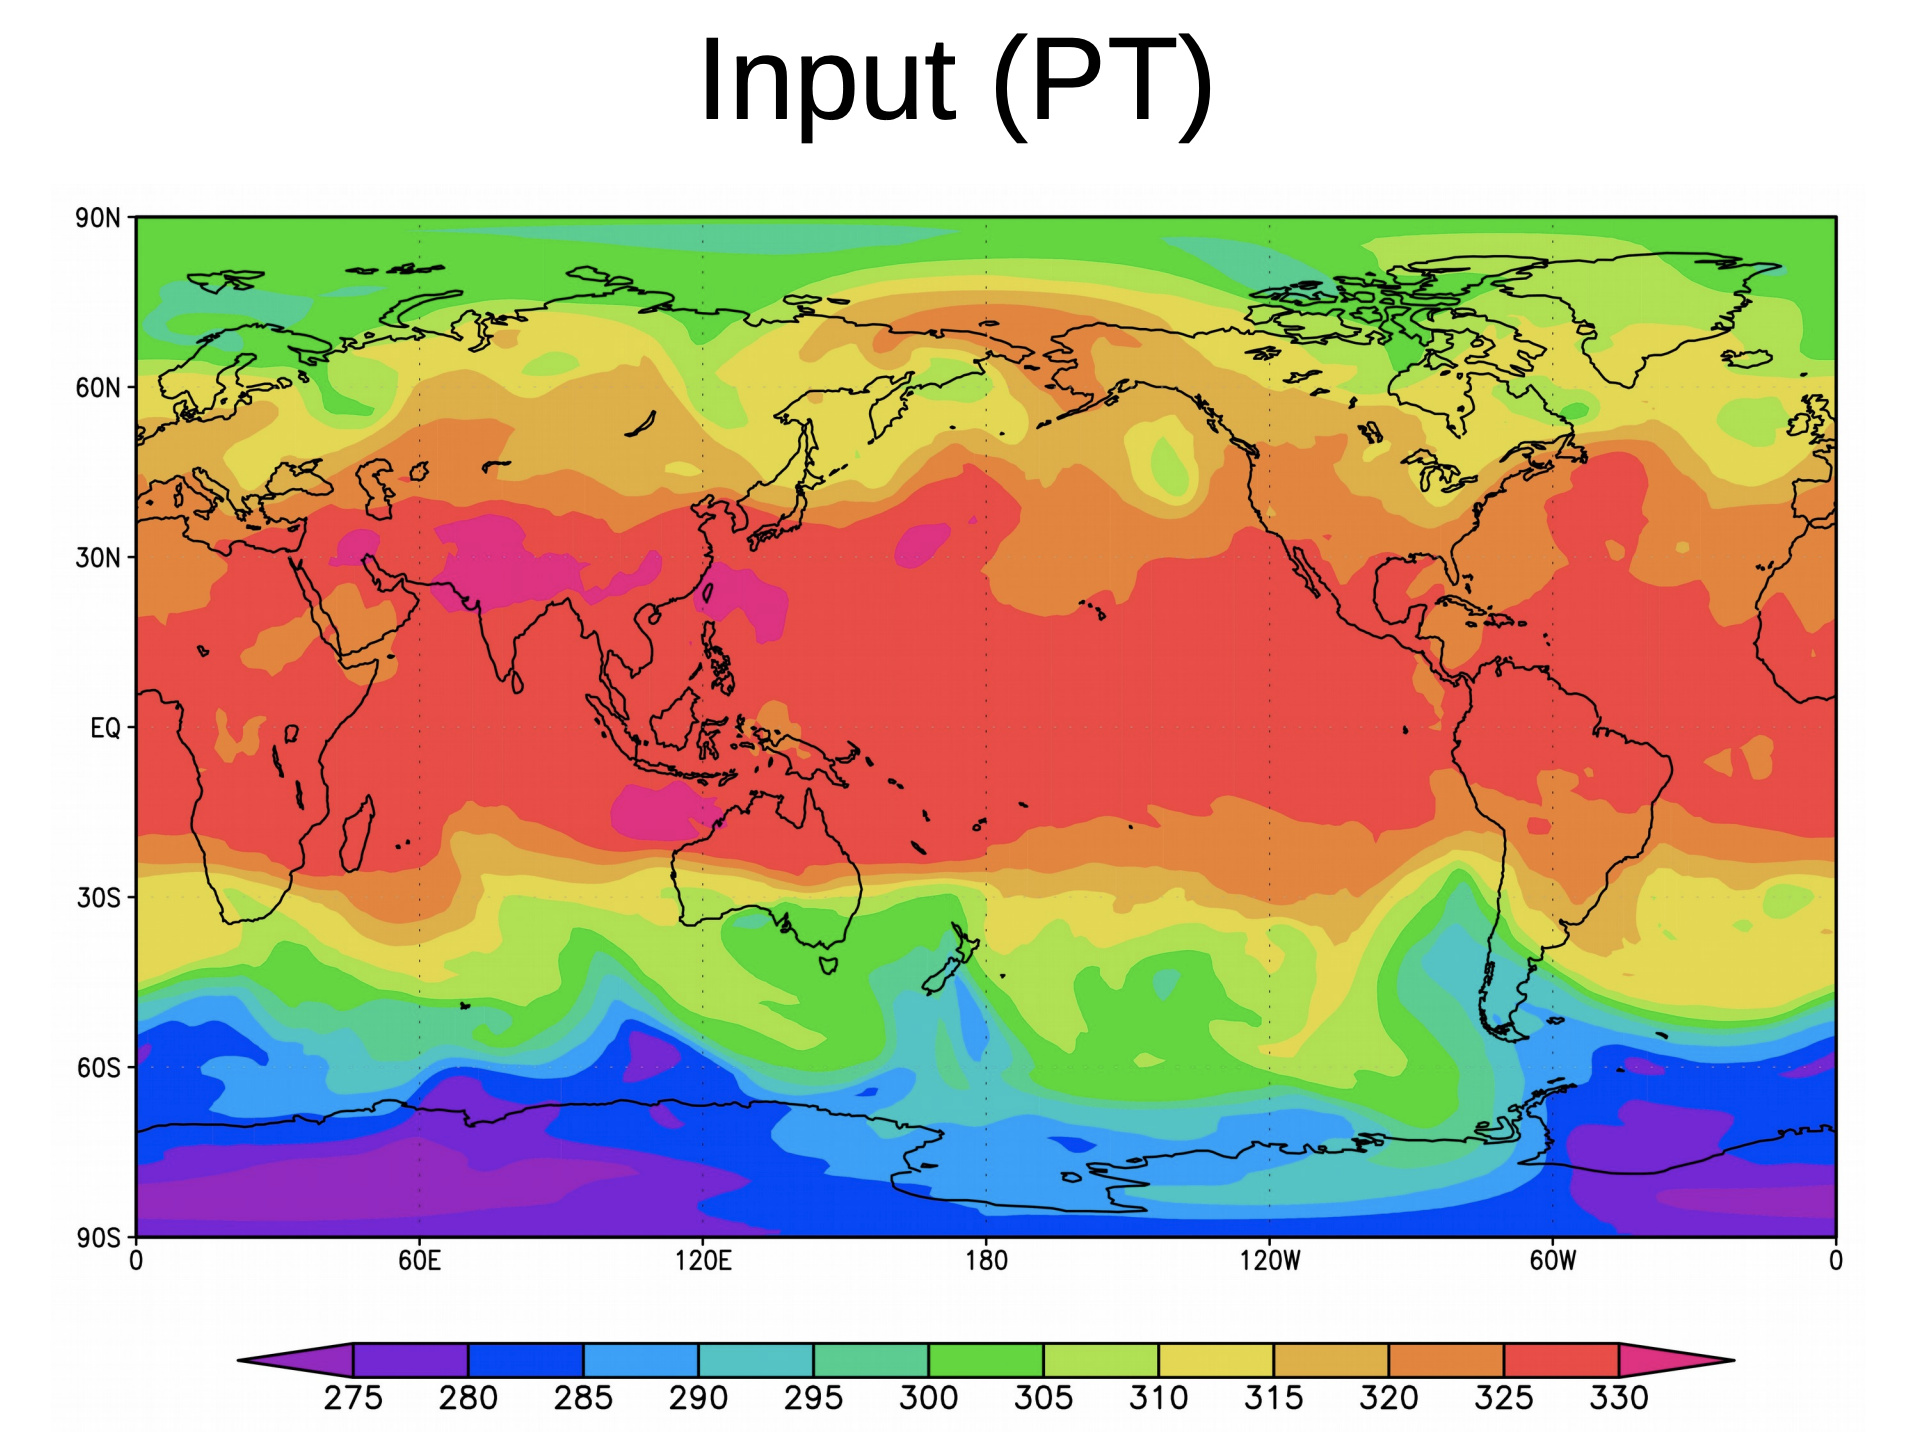
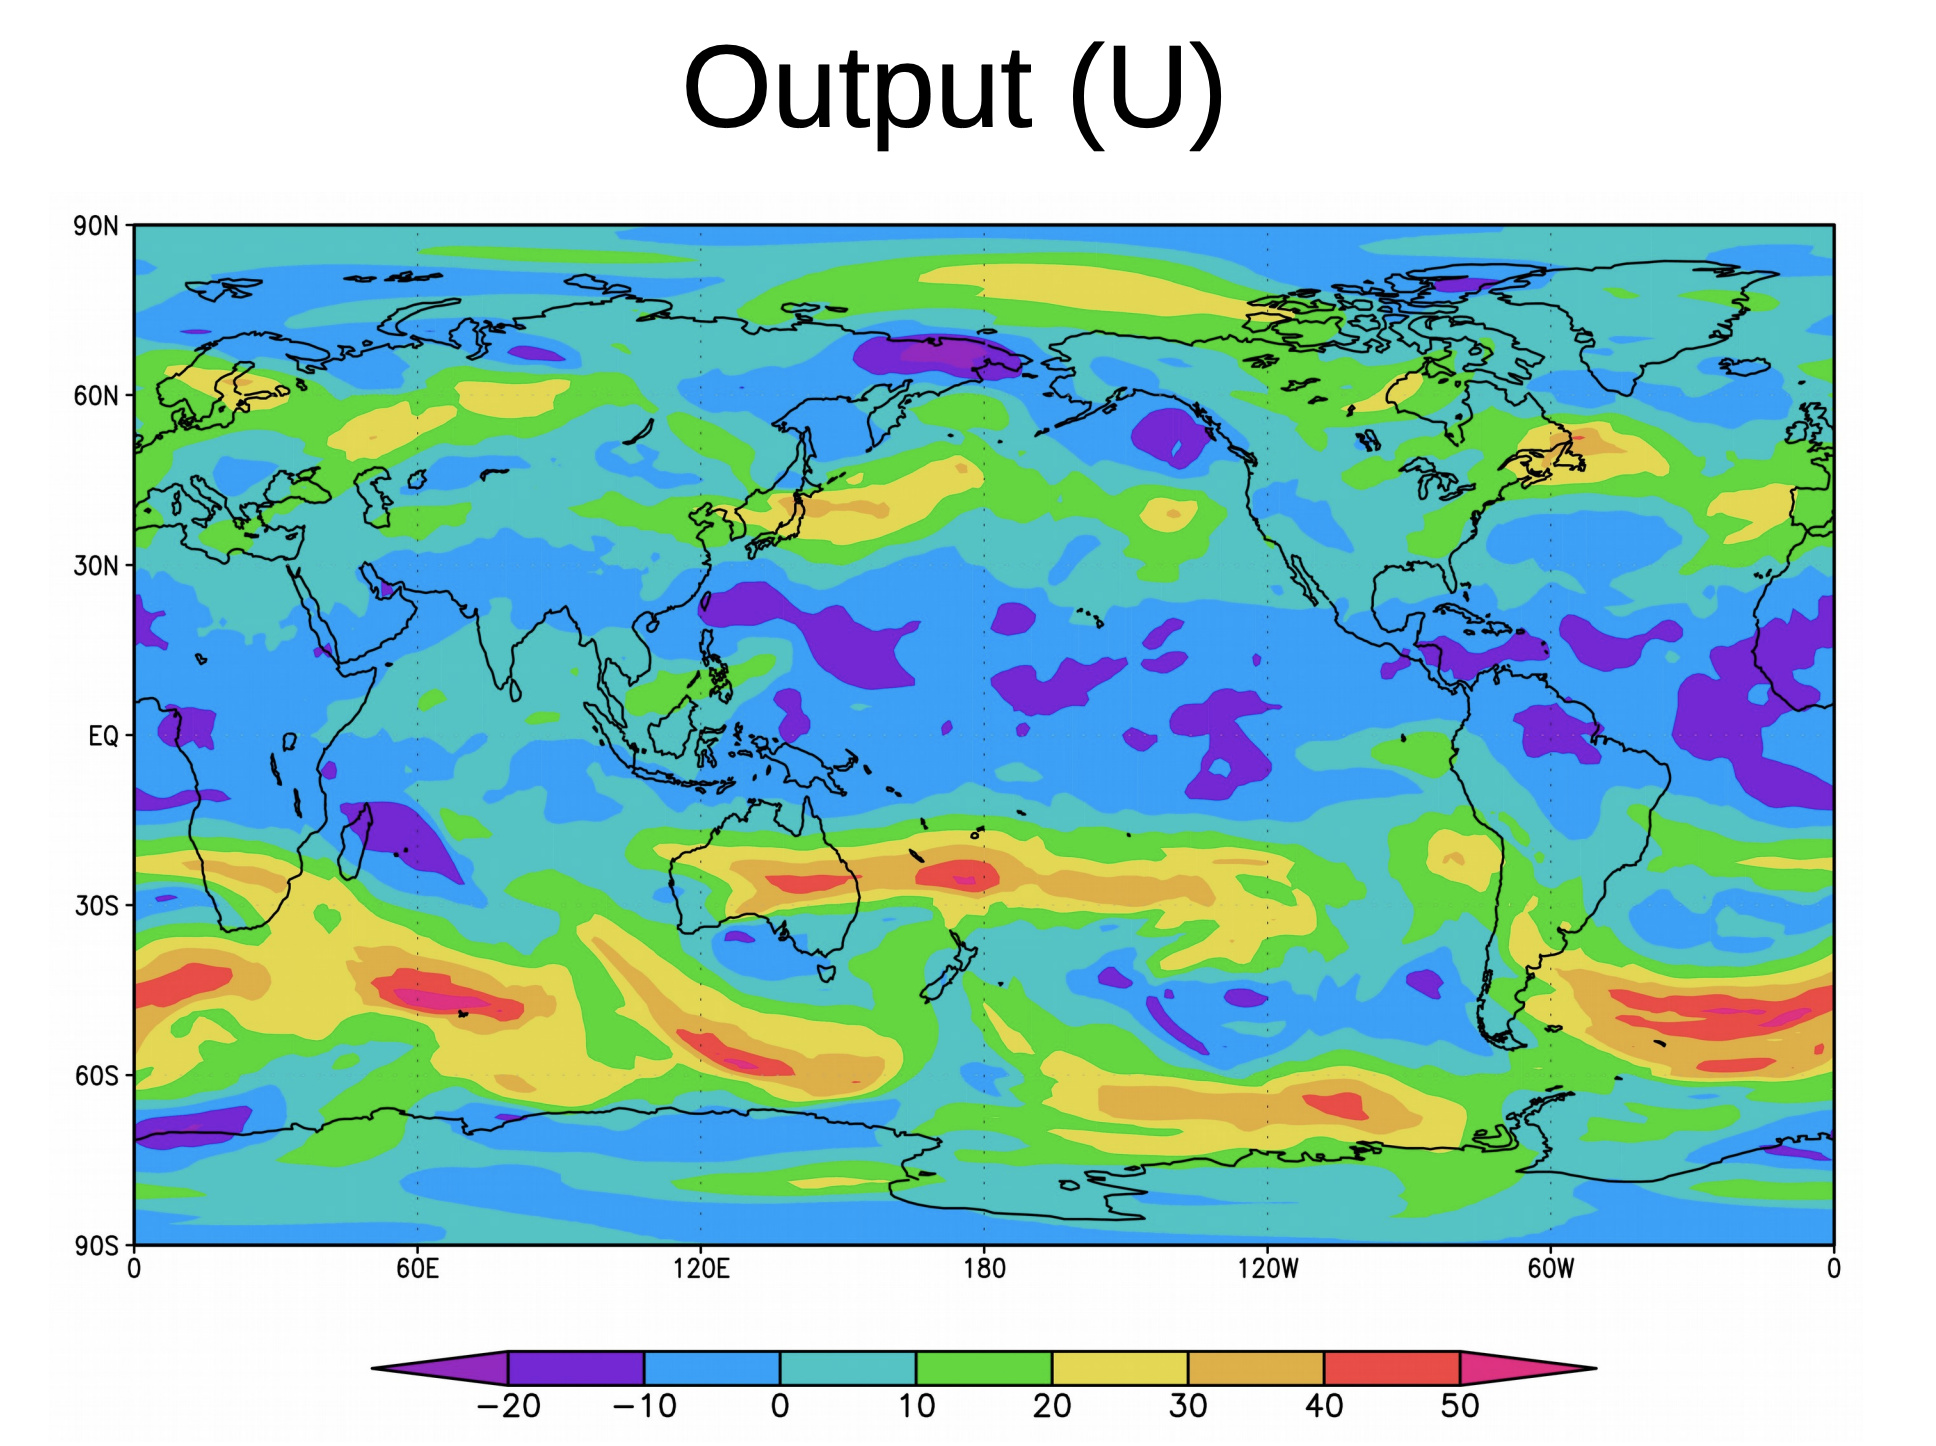
A colleague who works in climate modeling recently asked if it is possible to replace a physics model with a deep learning model. So, for example the input would be an image like this one:
These are the kind of data that one finds on Google Earth Engine. Does anyone know if this sort of thing is at all solvable using deep learning techniques? I’m guessing that seeing that the output is an image, some sort of generative model is required. Any pointers will be much appreciated.
If the output can be computed from the input using some deterministic equation it shouldn’t be hard to train a U-Net model in regression mode to map the input to the output. Or do you mean a model to do forecast for the future?
Doing something similar now but on the scale of a city/district. The way you’ve explained it, it seems like an image-to-image translation in a single domain context with paired data. The state of the art in this case, at least in my experience, is still pix2pix. I’d go with that for my first try, I’ve had very good results so far in my cases.
Dave thanks for sharing your work man, pretty amazing stuff!
I wonder if you’ve done any work on height prediction/calculation. The things we can tackle with these models, e.g. solar panel location as you point out, require knowledge about heights and self/context shading impacts.
I had this bookmarked a while back, but never went there: https://github.com/MISS3D/s2p. Wonder if you’ve had any experience? I am not sure this can be done as a prediction task, since the input required would already be enough to produce heights. Not sure though, as I’ve never tried.
The outputs are solutions to some Helmholtz equations. In this case, they are to do with the evolution of tropical cyclones, so there is a bit of a forecast element in it, but I think in numerically solving the equations, only a couple of time steps before and after are taken into account. Currently, the numerical solution is not stable; it sometimes diverges, so my colleague was wondering if it’s possible to just train on examples where the solution is ‘nice’.
I can’t tell if it would work, but maybe it worth trying! As long as the input data has enough information to produce the output it should be possible to train a model to perform the task.
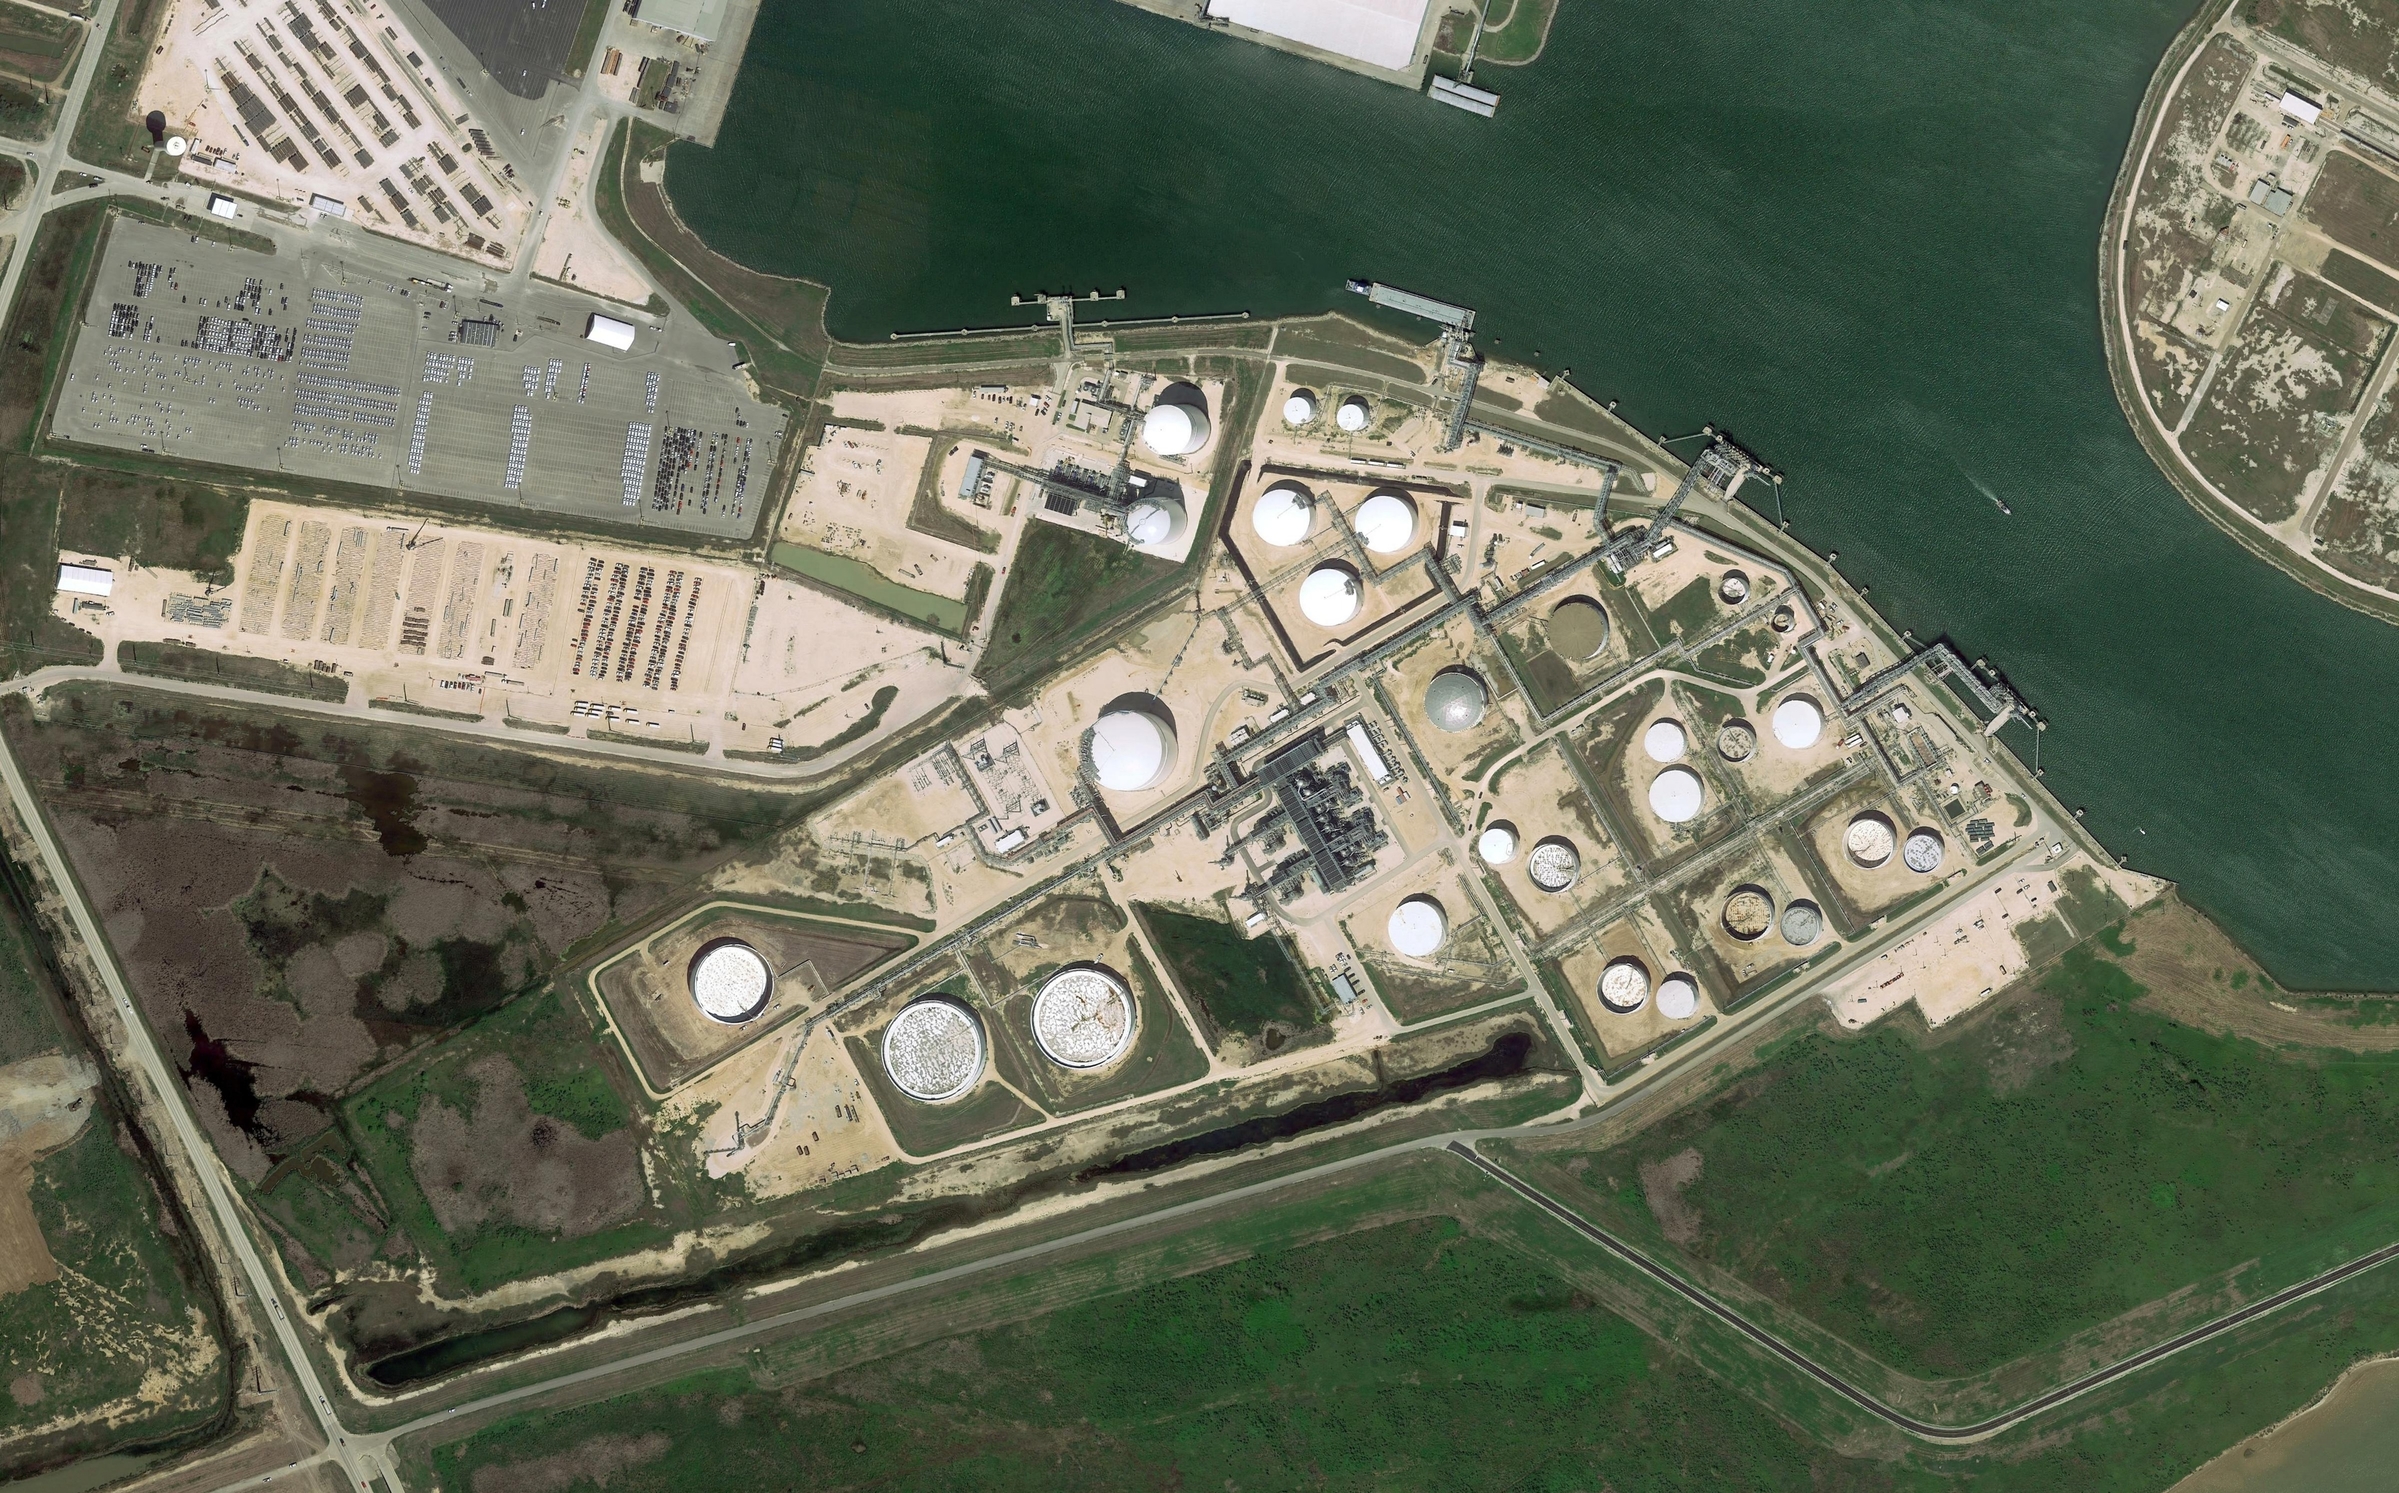
Some friends and I are thinking about creating an object detection dataset for industrial tanks using Google Earth Pro. Does anyone here know or have resources on best practices for this sort of thing?
Some things on our mind:
What’s the best way to standardize the scale of the images?
If we want the data to be RGB images, is there any advantage to signing up for Google Earth Engine?
Is there a way to save metadata with an image? Specifically high accuracy coordinates of the four corners of the image.
What other location information would be useful to save?
In Google Earth Engine you can export images as georeferenced tiff. And to create the annotations this topic has some suggestions: Image annotation tool
Usually no data is not a specific class, it is just no output. That is why you should look at the output of the network before the softmax. Jeremy stated correctly that creating a class for “background” is always a bad idea, as the network detect features in images, no the absence of.
For your particular task, I would look at the kaggle Planet Dataset and try to reutilise some of it, there is a huge amount of data, correctly labeled. We had at my old lab a manually crafter ArcGis database of the region of Grenoble with polygons describing the categories you look for.
Try the Fiji app.
Use focal loss type/ oversample the hard classes.
If your training data has this type of example, yes.
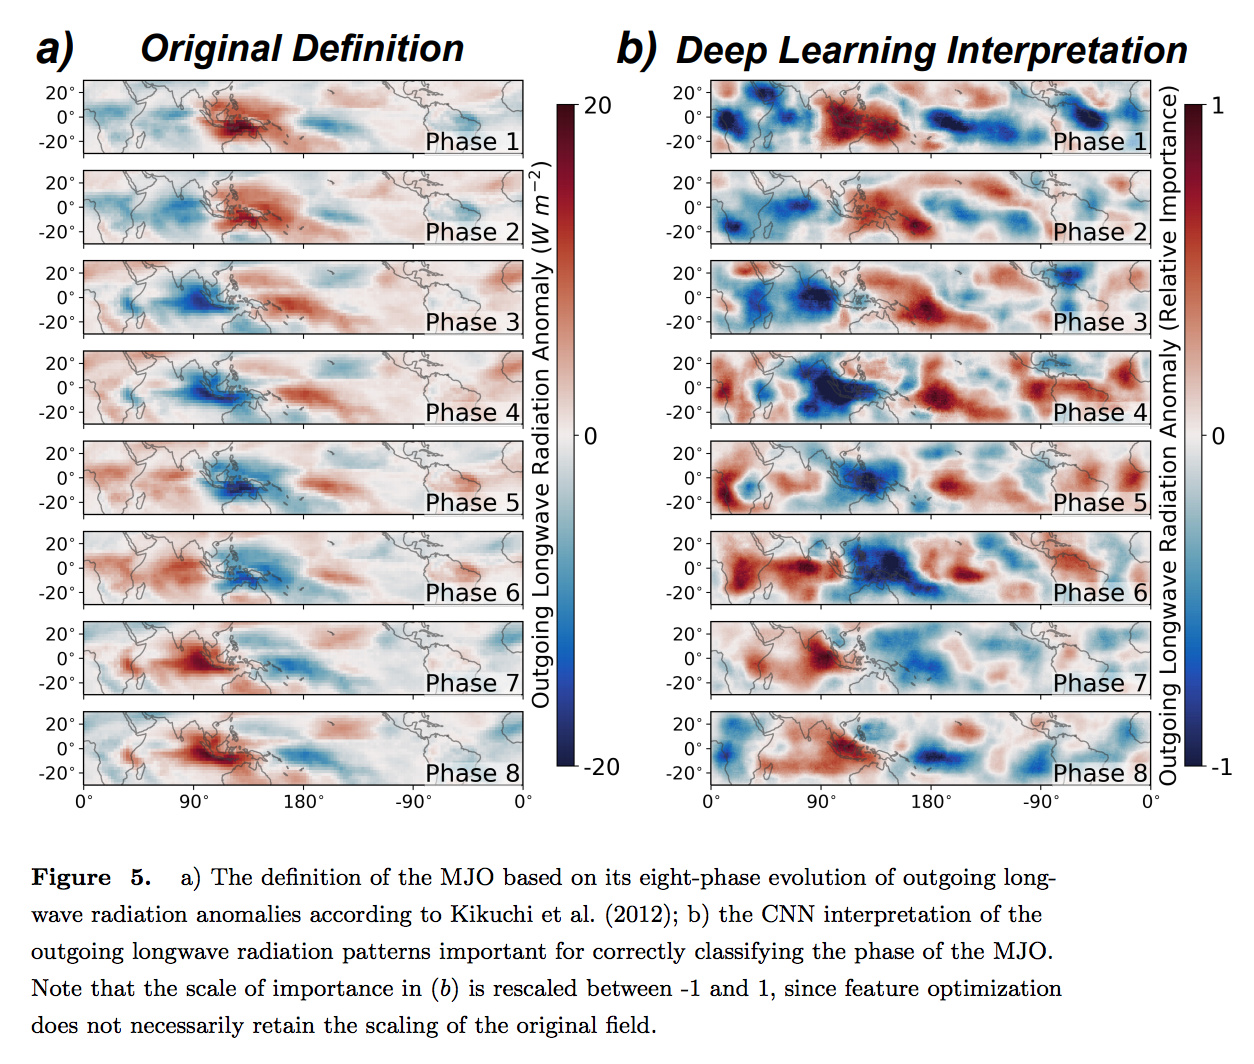
I don’t know much of anything about physical climate modeling but did attend a conference session at AGU 2018 about this topic out of curiosity to see what folks were working on. From my naive understanding, this work looks similar to what you’re asking about?:
For picking a standard scale, I’d recommend picking one of the zoom levels that visibly gives you good resolution and pixel-wise balance of the object of interest (industrial tanks) vs background.
And if you use a tile server, you can direct get tiles at a specific zoom level which is already squares (usually 256x256, or 512x512 for “retina” tiles) following a standard z/x/y numbering system that converts back and forth to geographic coordinates: https://wiki.openstreetmap.org/wiki/Slippy_map_tilenames#Python
As mpinto suggests, you can export/save images as geotiffs which contain the bounding box coordinates, coordinate reference system, and band-by-band details in the file metadata. Or if using map tiles, you already have the bounding box coordinate conversion in the tile numbering and then you can save the individual tiles as jpgs or pngs.
Re: annotation, rather than use a generic labeling tool, for geospatial data I would recommend drawing the polygons as geojson shapes which saves the geo-coordinates (which you can do interactively within Google Earth Engine: https://developers.google.com/earth-engine/playground#geometry-tools) and then convert the geojson shapes at a subsequent step into relative pixel display coordinates.
CosmiqWorks (the SpaceNet folks) recently released some utilities just for these geoML preprocessing purposes: https://github.com/cosmiq/cw-geodata
The Planet dataset on Kaggle is tasked for tile/chip-wise multi-label classification. For land use/land cover (LULC) multi-class segmentation, the Kaggle DSTL one is good but small and there’s the DeepGlobe LULC challenge dataset which is 803 RGB 50cm satellite images (2448x2448) labeled for segmentation to 7 classes.
Re Q3:
You could also convert pixel-level predictions to Shapely shapes/GeoJSON file, edit these interactively, then convert the corrected shape back to pixel mask. Not perfect but editing the vertices of polygons is probably faster and simpler than doing it at a pixel level.
Re: Q4 of imbalanced classes, besides focal loss which could work well, you could also try a combined loss that includes something like dice score to penalize “global” mistakes and is less prone to the model guessing just the majority class. You could also oversample by generating more or copying (+ data aug) training images that contain your minority/hard class.
There are several groups mapping different areas. But there is lots of help needed to map small roof top solar panels. For example in the UK we have found access to 25cm aerial imagery, and in the USA there are a few groups doing this. There is also a global utility scale dataset being released soon.
But we haven’t got any other countries in progress! If you’d like to have a go at solar PV detection (mainly small roof top panels) using ML for a particular country, we invite you to.
The biggest hurdle is usually imagery. We’ve found Mapbox has high resolution global coverage, but for many countries the quality is too low. So it’s worth exploring domestic satellite and aerial imagery providers. Some may be open to giving access to data for educational or research purposes.
Please pay particular attention to imagery licensing. We want to be able to aggregate and freely distribute PV panel maps for research and impact climate change. This includes pushing results to OpenStreetMap. For example, results derived from Google Maps imagery cannot be openly distributed. But Mapbox explicitly states you can use their imagery to improve OpenStreetMap.
Thanks @dctanner for posting this opportunity! I’ve added your links to a new Opportunities section at the top wiki post with other new resources and links. Please feel free to add/edit the wiki directly with more information.
Another great place to find and make use of open-source overhead imagery, especially drone/aerial imagery which works well for roof-top solar is at:
Random question for those who are experienced with geospatial data. I’m interested in making a model to detect topes (pretty giant speed bumps all over Mexico) from satellite images. Before I dig deeper, is this possible from satellite or are the objects going to be too small to be detectable? (They are often colored but the most interesting ones would be uncolored). Sorry I haven’t done my homework on this one but I would rather hear if it’s possible before going down another rabbit hole. Thanks.
Spot 6 & 7 (https://eos.com/spot-6-and-7) got 1.5 m resolution, but I guess you would need to check a few examples to see if it is really feasible. I guess the uncoloured ones may be a problem to see from above.
It’s a kind of task that would be easier using data collected from cars, like Tesla’s that have cameras and sensors recording all the time. Or another way around, for an app like google maps or a similar one with a high number of users, by allowing users to input the information of where there is a bump.
Thanks, yeah allowing users to input information is our ultimate solution, especially because topes come and go, but we had the idea to bootstrap with satellite data to capture maybe 20-40% of them to make the app somewhat useful to begin with. Otherwise it’s hard to get users to input.
 would love some input !!