Dogs_cats_redux error --> "y_true contains only one label"

Hi everyone,
I am running this code:
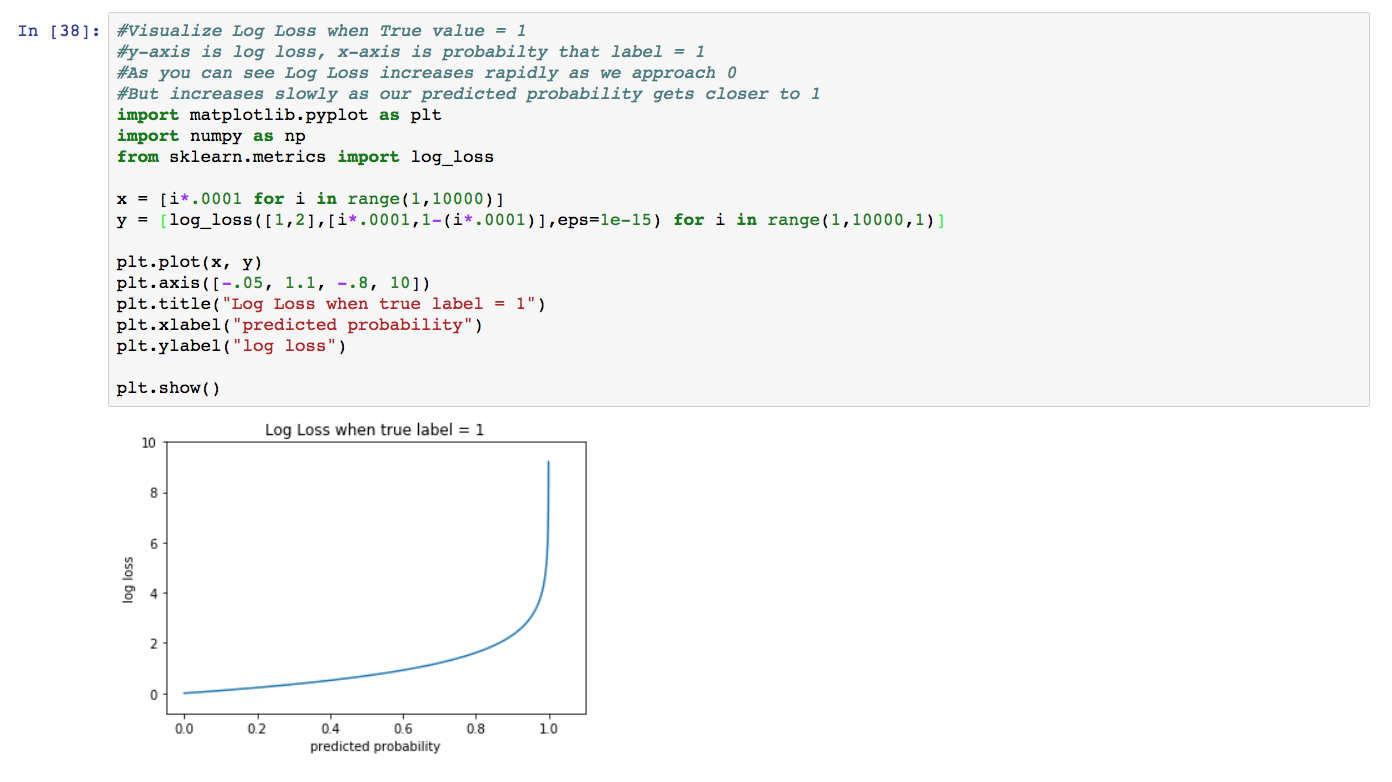
https://github.com/fastai/courses/blob/master/deeplearning1/nbs/dogs_cats_redux.ipynb in my dev box.
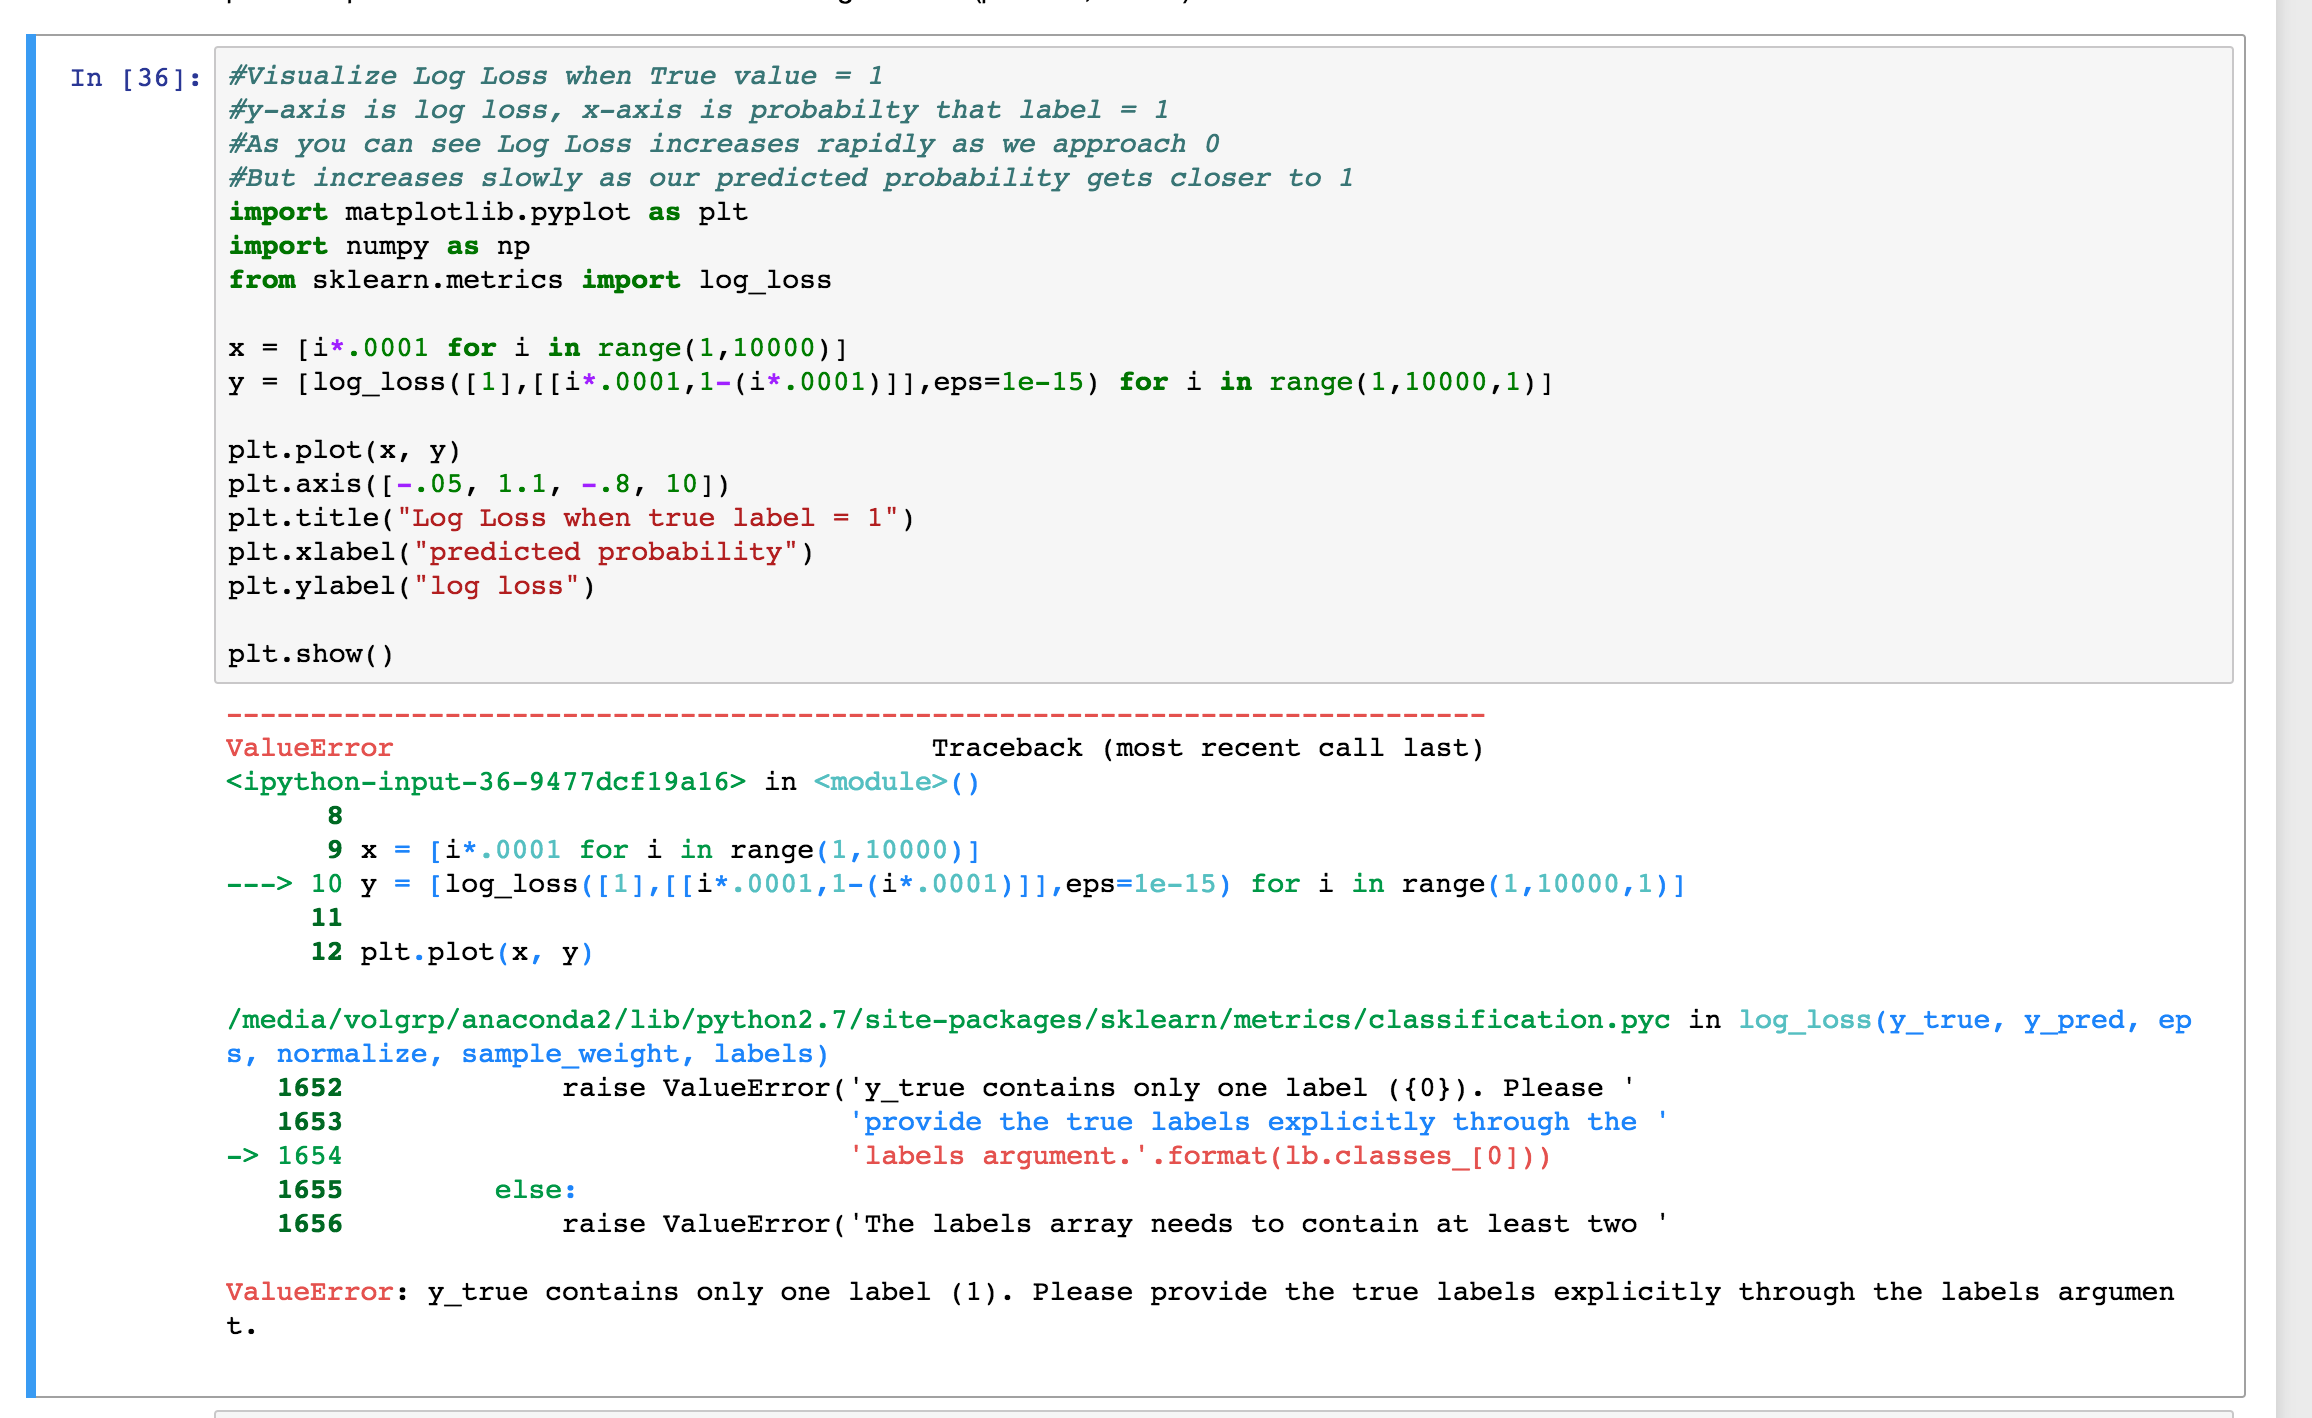
All the previous cells went well, until this cell “Visualize Log Loss”, I got following error:

ValueError Traceback (most recent call last)
in ()
8
9 x = [i*.0001 for i in range(1,10000)]
—> 10 y = [log_loss([1],[[i*.0001,1-(i*.0001)]],eps=1e-15) for i in range(1,10000,1)]
11
12 plt.plot(x, y)

/media/volgrp/anaconda2/lib/python2.7/site-packages/sklearn/metrics/classification.pyc in log_loss(y_true, y_pred, eps, normalize, sample_weight, labels)
1652 raise ValueError('y_true contains only one label ({0}). Please ’
1653 'provide the true labels explicitly through the ’
-> 1654 ‘labels argument.’.format(lb.classes_[0]))
1655 else:
1656 raise ValueError('The labels array needs to contain at least two ’

ValueError: y_true contains only one label (1). Please provide the true labels explicitly through the labels argument.

See my screen shot.


Could anyone tell me, what’s wrong here ?

Looking through the source code of sklearn/metrics/classification.py in scikit-learn, this is likely a version compatibility issue.

def log_loss(y_true, y_pred, eps=1e-15, normalize=True, sample_weight=None,
labels=None)
if len(lb.classes_) == 1:
if labels is None:

In Jeremy’s code, it is calling in this way:
y = [log_loss([1],[[i*.0001,1-(i*.0001)]],eps=1e-15) for i in range(1,10000,1)]
the labels param is not passed.
Could anyone tell me which version of scikit-learn to install ?

In the prediction we are passing 2 values so we have to update the y_true and also remove an extra [ ] around prediction like below:

y = [log_loss([1,2],[i*.0001,1-(i*.0001)],eps=1e-15) for i in range(1,10000,1)]

@ravikg thanks, I have used your update: y = [log_loss([1,2],[i*.0001,1-(i*.0001)],eps=1e-15) for i in range(1,10000,1)]
and get following output, which is weird.


I am trying to understand what happen here: )

My mistake, I couldn’t understand the label properly.
So true label is 1 and false label is 0 so it should be:

y = [log_loss([1,0],[i*.0001,1-(i*.0001)],eps=1e-15) for i in range(1,10000,1)]

it should give you the correct graph.
For more details about log_loss with 1 class, see this doc: http://scikit-learn.org/stable/modules/generated/sklearn.metrics.log_loss.html

@ravikg, thank you very much