Thank you! This is great!
What I am trying to understand is could we really just make square spectrograms by just setting up figsize? Spectrogram is basically time vs. frequency plot, and by making it square we tend to distort the time part (maybe frequency part too?). I am not sure about music, but for bioacoustic signals this distortion could be problematic, I think.
Here is a new paper on using CNN for bioacoustic classification
They did not just made square spectrograms from sound files, instead they cut sound files into what they called “fixed length sound frames” and it seems to be a somewhat complicated process. After that cutting they did STFT for each frame, used Hamming window, FFT 1024, etc. :
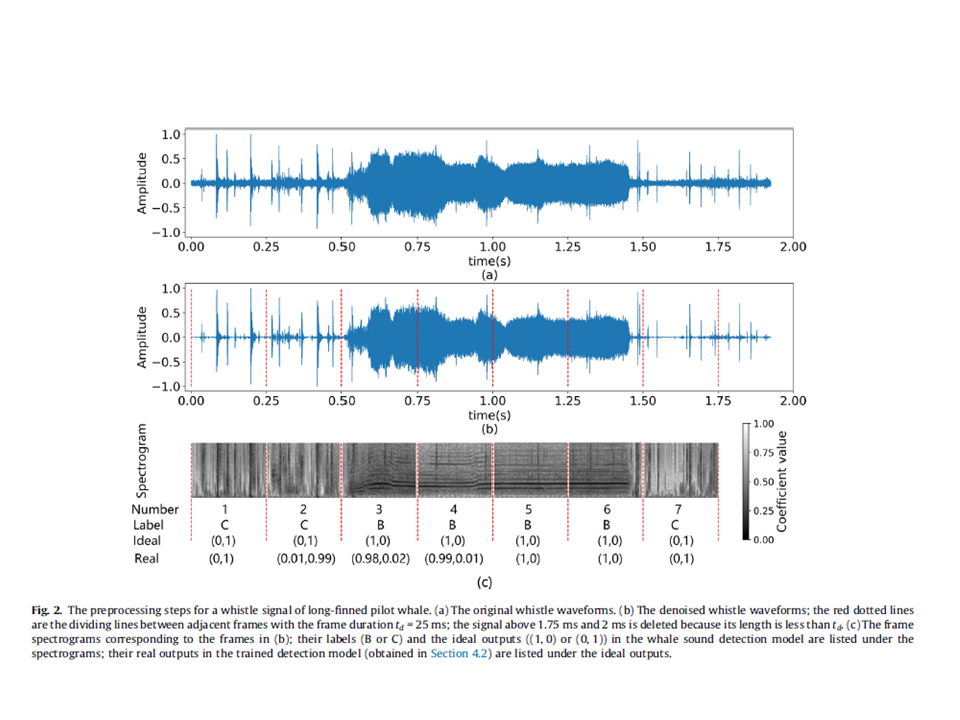
All the denoised sounds in the data set are sequentially cut into
sound frames with a duration of td (no overlapping between adjacent
frames). The sound frame with a length of less than td at the
end of the sound file is discarded. The Short Time Fourier Transform
(STFT), with Hamming window, a segment length of td/40,
segment shift of td/80 and FFT length of 1024 samples, is computed
for each sound frame. In order to show more details in the spectrogram,
the STFT coefficients are logarithmized by Eq. (1).
Z ¼ log10ðjZjÞ ð1Þ
where Z is the STFT coefficients matrix for each sound frame.
If the value of td is too small, some short-term pulse interference
may also be misdetected; if the value of td is too large, the signal
detection accuracy is lowered. Based on the durations of the
whistles from both whale species, td is set to 250 ms. In addition,
the time interval between most adjacent whistles is greater than
td, so the paper does not discuss the case where two whistles are
falsely detected as a whole whistle due to the short signal interval
(<td).
Further, for each sound frame, based on the preprocessed STFT
coefficients Z, a frame spectrogram (grayscale) of 180 * 120 pixels
is obtained by the pcolormesh method in matplotlib [24] to visualize
the STFT result. Fig. 1(b) and Fig. 2(b) show the start and end
positions of the frames for the denoised sound, and Fig. 1© and
Fig. 2© show the corresponding frame spectrograms. As can be
seen, the contours of whistles have been enhanced.
I am very confused about this, because I have a bunch of labeled 10 sec spectrograms I have no idea what to do with. I can make them square and it will distort frequency/time relationship. I cannot use them as is, because the model will just randomly make squares from them in the middle and in some files of interest the signals are not in the middle, will be missed, but the file will still be labeled as containing signal of interest. So the model will be confused.

