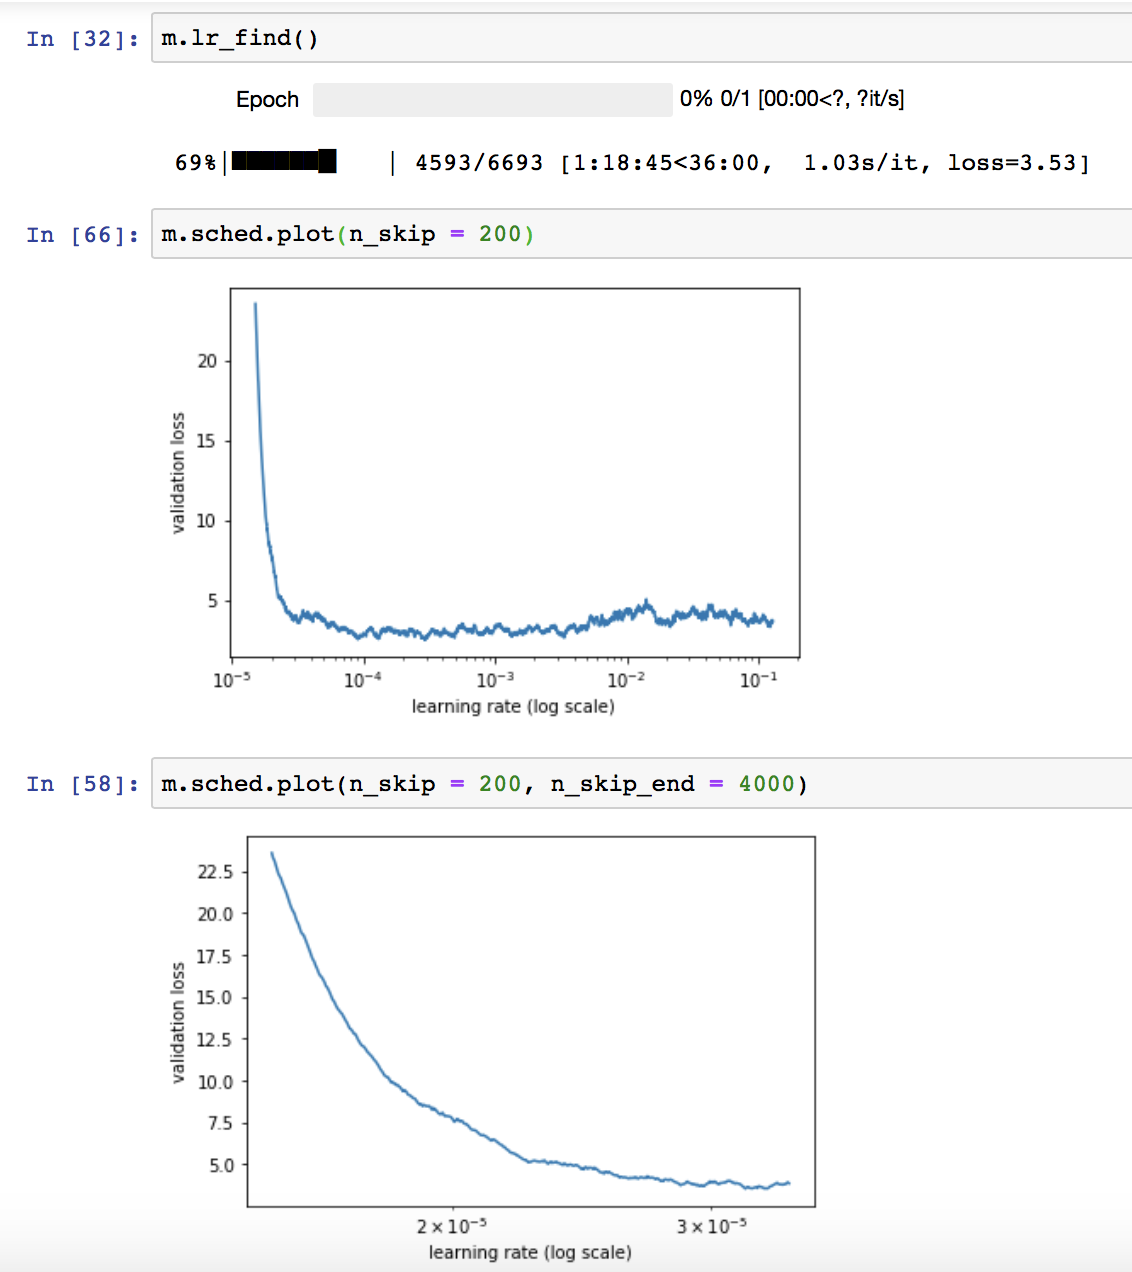
I’m running the learning rate finder on a kaggle dataset and (structured, regression) and I’m getting a plot as shown in the screenshot below.
If I zoom into the plot, it seems that somewhere around 2*1e-5 is the best learning rate, but I never really see the point where loss really starts to become unstable – it just kind of remains the same as the lr increases…
Am I reading this correctly? Should I be doing something differently (increase/decrease batch size?)?
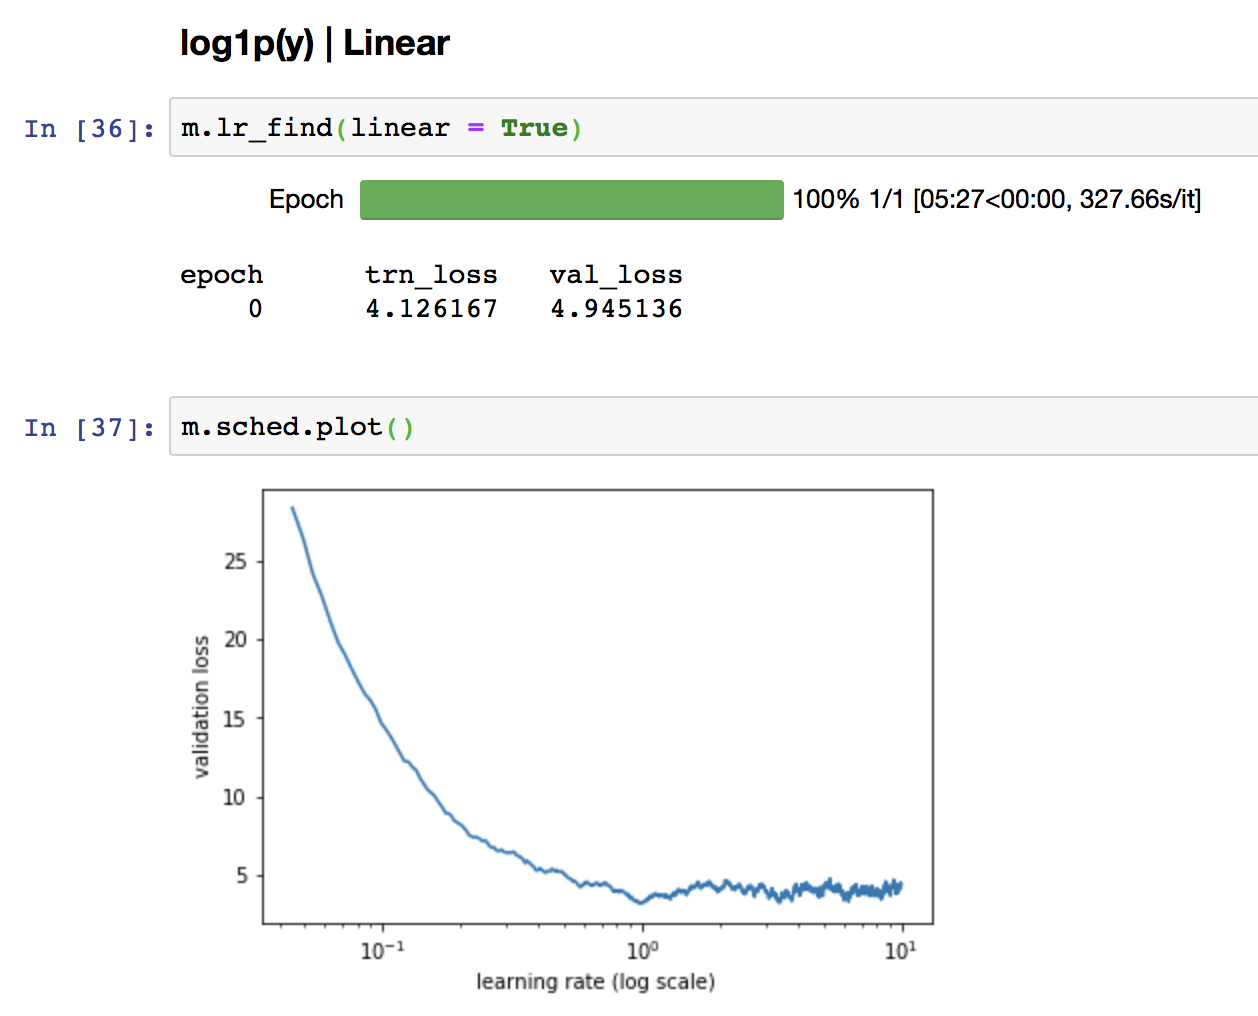
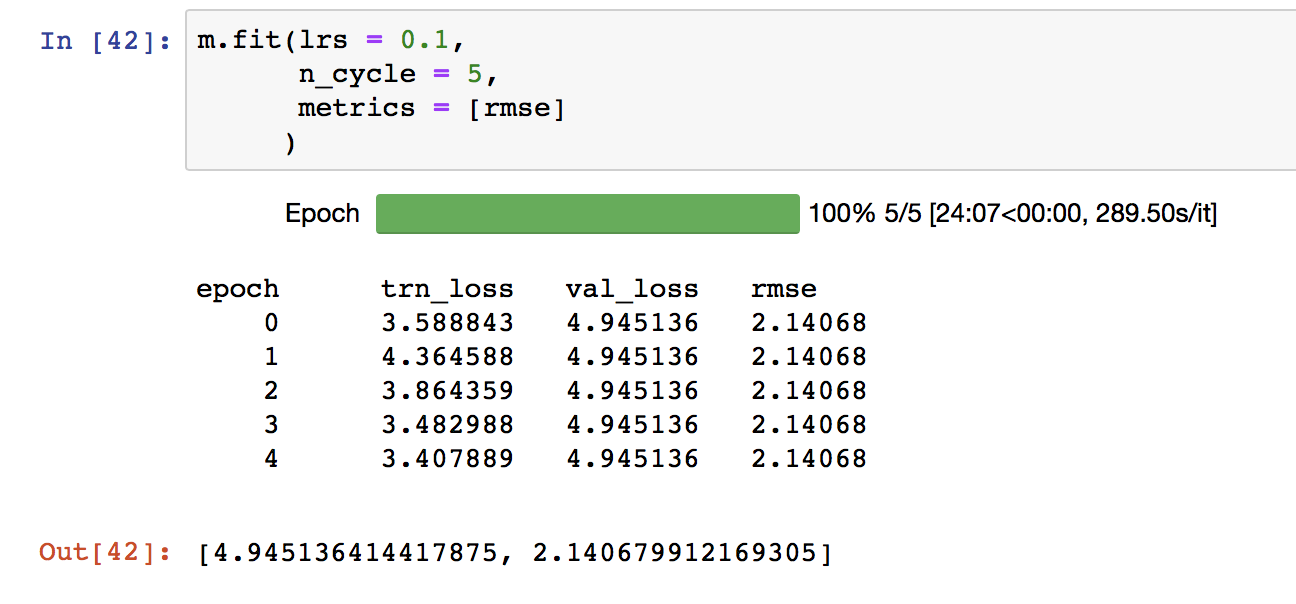
Unfortunately, adding the linear = True doesn’t help that much – if I used the learning rate suggested then it looks like I get stuck in a local minimum:
I played around with batch size but that didn’t seem to have too much of an effect (in regards to seeing what I would expect after watching the lectures).
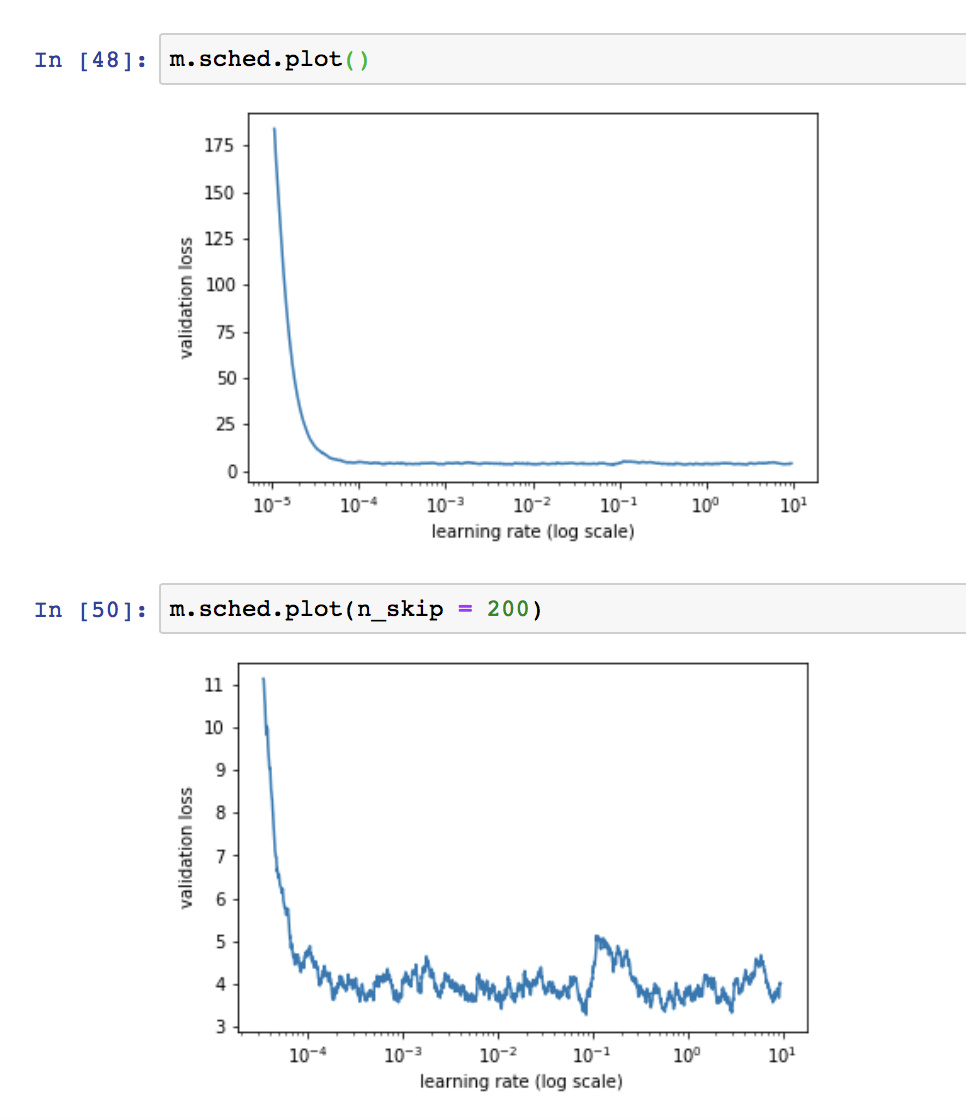
Increasing the complexity of the model (adding an additional layer with additional activations, from [1000, 500] to [2000, 1000, 500]), but it seems the schedule plot remains the same:
I had some extra time so I decided to read through the paper again extra closely – do you think my situation qualifies for the 1cycle method described in the paper?
(I’m going to test it out anyway, just wondering if I’m understanding when to use it correctly)