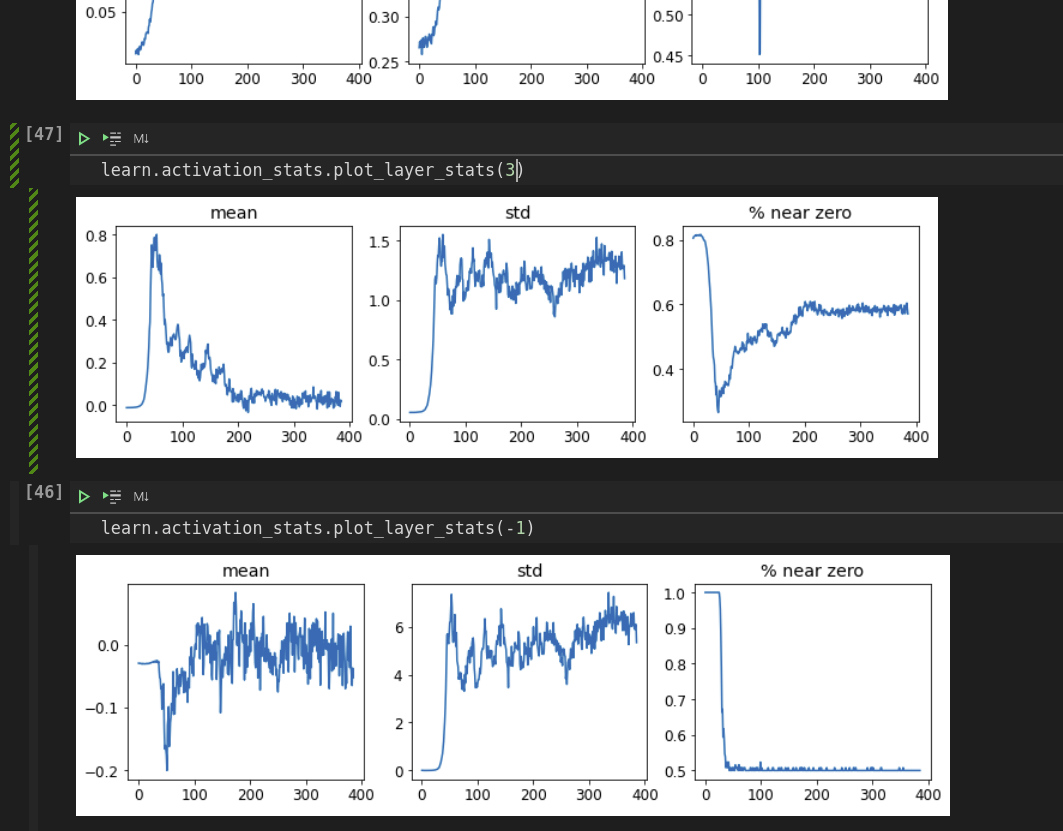
Why is the x axis always 400? I thought from summary that the number of activations per layer is going down?
Sequential (Input shape: 64) ============================================================================ Layer (type) Output Shape Param # Trainable ============================================================================ 64 x 4 x 14 x 14 Conv2d 40 True ReLU ____________________________________________________________________________ 64 x 8 x 7 x 7 Conv2d 296 True ReLU ____________________________________________________________________________ 64 x 16 x 4 x 4 Conv2d 1168 True ReLU ____________________________________________________________________________ 64 x 32 x 2 x 2 Conv2d 4640 True ReLU ____________________________________________________________________________ 64 x 2 x 1 x 1 Conv2d 578 True ____________________________________________________________________________