The fix for this bug has been merged recently, make a pull of fastai repo.
Thanks for the info. After git pull it’s working fine now.
Hi all. I have a problem on the predicting structured data part of Lesson 4. I ran the notebook but got different results. My exp_rmspe is so small comparing to what shown in the course. I didn’t change anything. The data I download from the link given in the notebook dataset
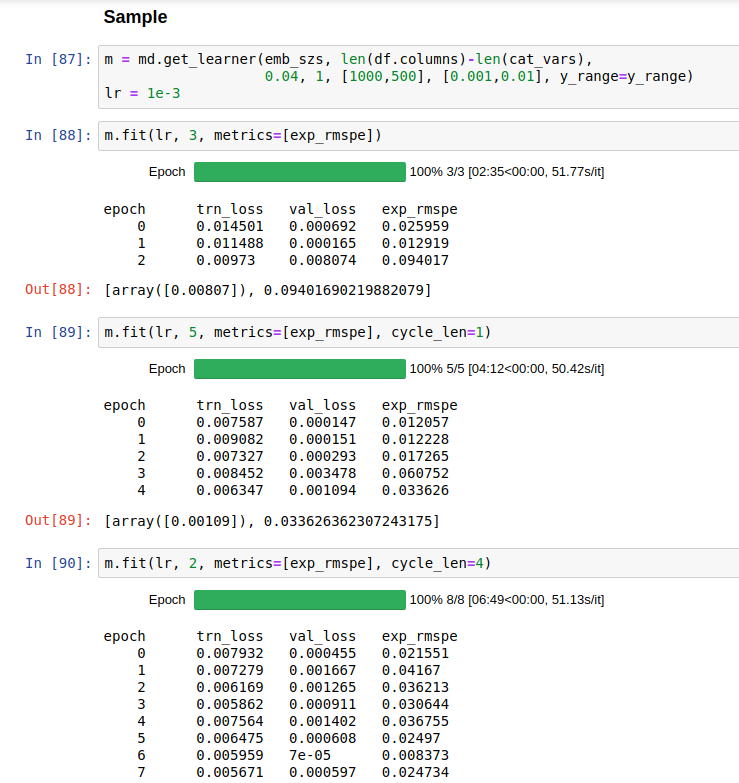
I am very appreciate if someone can help me on this problem. Or can you rerun the notebook to see if you can get the same results or maybe the fastai library change something ?
Thank you
Hello,
I’m reading AWD LSTM paper https://arxiv.org/abs/1708.02182
And I cannot understand why in introduction they say
A naïve application of dropout (Srivastava et al., 2014) to an RNN’s hidden state is ineffective as it disrupts the RNN’s ability to retain long term dependencies
What was the state of the art before this article?
And why dropout disrupts RNN?
Update:
As far as I understand, RNN needs to remember the state, and applying dropout ruins state. There is no such problem for not recursive, as every batch has no information that influences next iterations
I get the same error:
sequence item 0: expected str instance, spacy.tokens.token.Token found
But I was not able to find a solution here in the forums?
Maybe somebody has a hint?
Is this due to an update of spacy?
Best regards
Michael
The notebook has several different ways of defining the validation indices. If you just run the notebook cells in order, you set val_idx=[0] (what you do before training with the entire dataset) before forming your model. If you ran the model with a single validation index, you would be comparing your rmspe to a single value. See what your validation set is, and if it is a single value, try change it to the last two weeks of data via:
val_idx = np.flatnonzero(
    (df.index<=datetime.datetime(2014,9,17)) & (df.index>=datetime.datetime(2014,8,1)))
4 Likes
I’m looking for some insight as to how the y_range parameter affects the model and the predictions it makes. Specifically, I’m trying to adapt the methods from the Rossmann example to another structured data problem where the predicted outcome is a binary value - 1, 0.
In the Rossmann notebook, we do the following:
df, y, nas, mapper = proc_df(joined_samp, 'Sales', do_scale=True)
yl = np.log(y)
max_log_y = np.max(yl)
y_range = (0, max_log_y*1.2)
m = md.get_learner(emb_szs, len(df.columns)-len(cat_vars),
               0.04, 1, [1000,500], [0.001,0.01], y_range=y_range)
With sales data, taking the logarithm of sales values works because all sales values are positive numbers. For something where the outcome values range from 0 to 1, taking the log doesn’t really make sense because you get (-inf, 0). Would I just set my y range lower limit to some aribtrary negative number, like y_range=(-100,0)?
Looking a bit deeper, how does y_range affect the prediction outputs of the model? My understanding was .predict() gave the log scale probabilities for a prediction. Is this still the case when output values are constrained by y_range?
1 Like
val_idx=[0] is the problem. Thank you a lot. I haven’t read carefully the code but supposing the original code should reproduce the same results. I forget that the original Jupyter notebook code are not run in order.
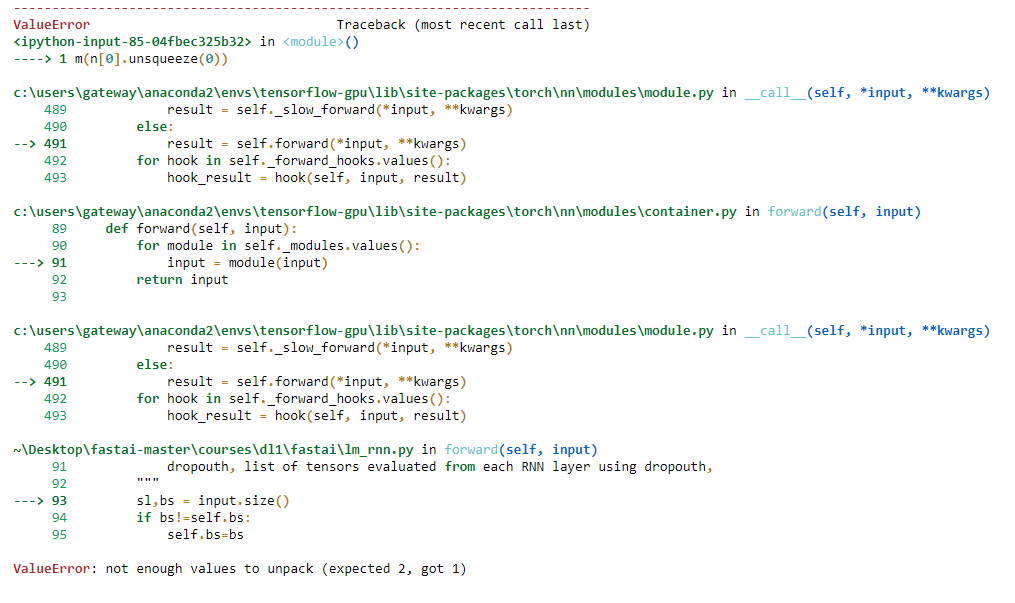
I have latest fast.ai from github and still get
ValueError: not enough values to unpack (expected 2, got 1)
when i run the cell:
print(ss,"\n")
for i in range(50):
n=res[-1].topk(2)[1]
n = n[1] if n.data[0]==0 else n[0]
print(TEXT.vocab.itos[n.data[0]], end=’ ‘)
res = m(n[0].unsqueeze(0))
print(res)
print(’…’)
under Test section. I can’t be the only one.
Currently experiencing this error. It looks like the line causing the error is
res,*_ = m(n[0].unsqueeze(0))
Looking at the stack trace, the issue is in
sl,bs = input.size()
ValueError: not enough values to unpack (expected 2, got 1)
Not really sure what’s going on, but when I run
n[0].unsqueeze(0)
alone, it returns
tensor([ 23], device='cuda:1')
Should it be returning something higher dimensional?
A question about RMSPE. Here’s the formula from Kaggle competition: 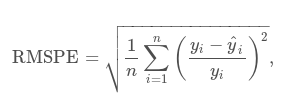
And here’s the implementation from jupyter-notebook:
def exp_rmspe(y_pred, targ):
    targ = inv_y(targ)
    pct_var = (targ - inv_y(y_pred))/targ
    return math.sqrt((pct_var**2).mean())
Shouldn’t we divide by y_pred (y_i on picture) and not by targ (y_hat_i on picture)?
So for me it should look more like this:
def exp_rmspe(y_pred, targ):
    y_pred = inv_y(y_pred)
    targ = inv_y(targ)
    pct_var = (y_pred - targ)/y_pred
    return math.sqrt((pct_var**2).mean())
And all this assuming we get log-values of targ variable while evaluating our metric (couldn’t find this part in source code). Will appreciate any help!
Hello everyone, I have a question regarding the embedding of unknown classes. Say if testing data has a new class that has never appeared in training, what will the embedding vector be for the unknown class? Is it randomly assigned?
In my opinion (which could be totally wrong), the most reasonable approach is weights for unknown classes are also trained (anything that is new in valid is considered as unknown), but this probably will involve apply_cats(train, valid) in addition to apply_cats(data, test).
I am asking because I am participating in a competition in detecting frauds, and for many categorial variables, the test data contain new categories. This could possibly mean that new attack methods are deployed in test (the testing data are more recent in time). In this case, the embedding weights of the unknown class could be very important. Any explanation/feedback is greatly appreciated!
1 Like
I think you confused notation. targ (our target, actual value) is y_i and y_pred (our prediction) is y_hat?
2 Likes
Yes, you’re correct. That’s totally my mistake. Thanks for help!
In the rossmann notebook:
y_range = (0, max_log_y*1.2)
If I get it, y_range specifies the range of values for y, and so my question is, how do find y_range for different datasets?
1 Like
Hmm, can anybody enlighten me how to write formulas here please?
Thank you very much for the reference! I’ve been breaking my head over this one because Jeremy did not explain this correctly.
So, we want to replace the correct output (y) and our predicted output (\hat{y}) by something so that an existing function (RMSE) of this “something” will be approximately RMSPE of the predicted output relative to correct output. They use the same function f for both the predicted and correct outputs, even though I don’t think they have to (the transformation of y is done offline in advance in any way we want, whereas to get \hat{y} from the output of the neural network, we would need to invert our f). So, the requirement is that f(y) - f(\hat{y}) = \frac{y - \hat{y}}{y}. Again, formally, it’s enough to have equality in absolute value because look at squares of these, but there is no reason not to aim for actual equality.
Now, is there such a function? First, there is no exact solution because, for example, the derivative with respect to y would be proportional to \hat{y}, i.e. f’(y) = \frac{\hat{y}}{y^2}, which does not make sense because f is a function of a single variable. But if we are aiming for \hat{y} to be close to y, we just need approximate equality between our RMSE and the actual RMSPE where \hat{y} \approx y. Then using Taylor’s expansion, we write f({\hat y}) \approx f(y) + f’(y)*(\hat{y} - y). Substituting into f(y) - f(\hat{y}) = \frac{y - \hat{y}}{y}, we get f’(y) \approx \frac{1}{y}. Since y is positive, we conclude that f is approximately the logarithm (plus a constant, which would be immediately eliminated in f(y) - f(\hat{y}), so we set it to zero).
I guess that since we’ve used a few approximations and assumptions along the way, the above is just good intuition for why to try the logarithm. We also need to check that it works well in practice - and apparently it does.
Quick question, can we use embeddings to representation a entire database table? I am trying to use some of the methods in this chapter to join two datasets with a one to many relationship? Its a binary classification task and the resulting matrix has duplicate results after joining on the id field as it should? Some ids have 5 records in the joining table while others have 2?
I wonder why, after engineering all these ‘Before’ and ‘After’ features, only the '‘AfterStateHoliday’, ‘BeforeStateHoliday’ features are used in training – they are listed among the “contin_vars”. But nowhere can I see the '‘AfterSchoolHoliday’, ‘BeforeSchoolHoliday’ and '‘AfterPromo’, ‘BeforePromo’ features. Am I missing something? Also, why are ‘StateHoliday_fw’, ‘StateHoliday_bw’ listed among “cat_vars”, but '‘AfterStateHoliday’, ‘BeforeStateHoliday’ listed among “contin_vars”? Anyone has any thoughts about this?
I think, to use RMSE as loss function Jeremy took log of y’s. Because of property of log(a/b) = log(a)-log(b). RMSE of log(y) will be same as RMSPE of y.
Please let me know if I am wrong.
Hello @KarlH,
I was playing around with the notebook from lesson 4 and got some test output with this code (I used n1 for the unsequeezing to get a 2D input):
print(ss,"\n")
for i in range(50):
    n1 = res[-1].topk(2)[1]
    n2 = n1[1] if n1.data[0]==0 else n1[0]
    print(TEXT.vocab.itos[n2.data[0]], end=' ')
    res,*_ = m(n1.unsqueeze(0))
print('...')
The output looks similar to this:
. So, it wasn't quite was I was expecting, but I really liked it anyway! The best

movie a worst movie i i me movie worth good . but i is not shame of <eos> do not that 's a a worst movie ever 've ever in but i 's n't good see see . anyone of people of <eos> 'm recommend recommend recommend to it movie ...
(The output includes this error message: UserWarning: invalid index of a 0-dim tensor. This will be an error in PyTorch 0.5. Use tensor.item() to convert a 0-dim tensor to a Python number.)
I’m not sure if this is correct because it looks reasonable to a very small degree and the spaces are placed incorrectly after the punctuation symbols.
Maybe the line with unsqueezing needs to be adapted that it takes 1D data?
Maybe I’ll try that later…
Best regards
Michael