I created a fast.ai callback that logs model and training information that can be viewed in tensorboard.
Tensorboard is a visualization tool that can help debug and explore your model. Read more about it here. Tensorboard is made for Tensorflow, but thanks to TensorboardX it also works with Pytorch.
Download the callback and an example notebook similar to lesson 5 at https://github.com/Pendar2/fastai-tensorboard-callback.
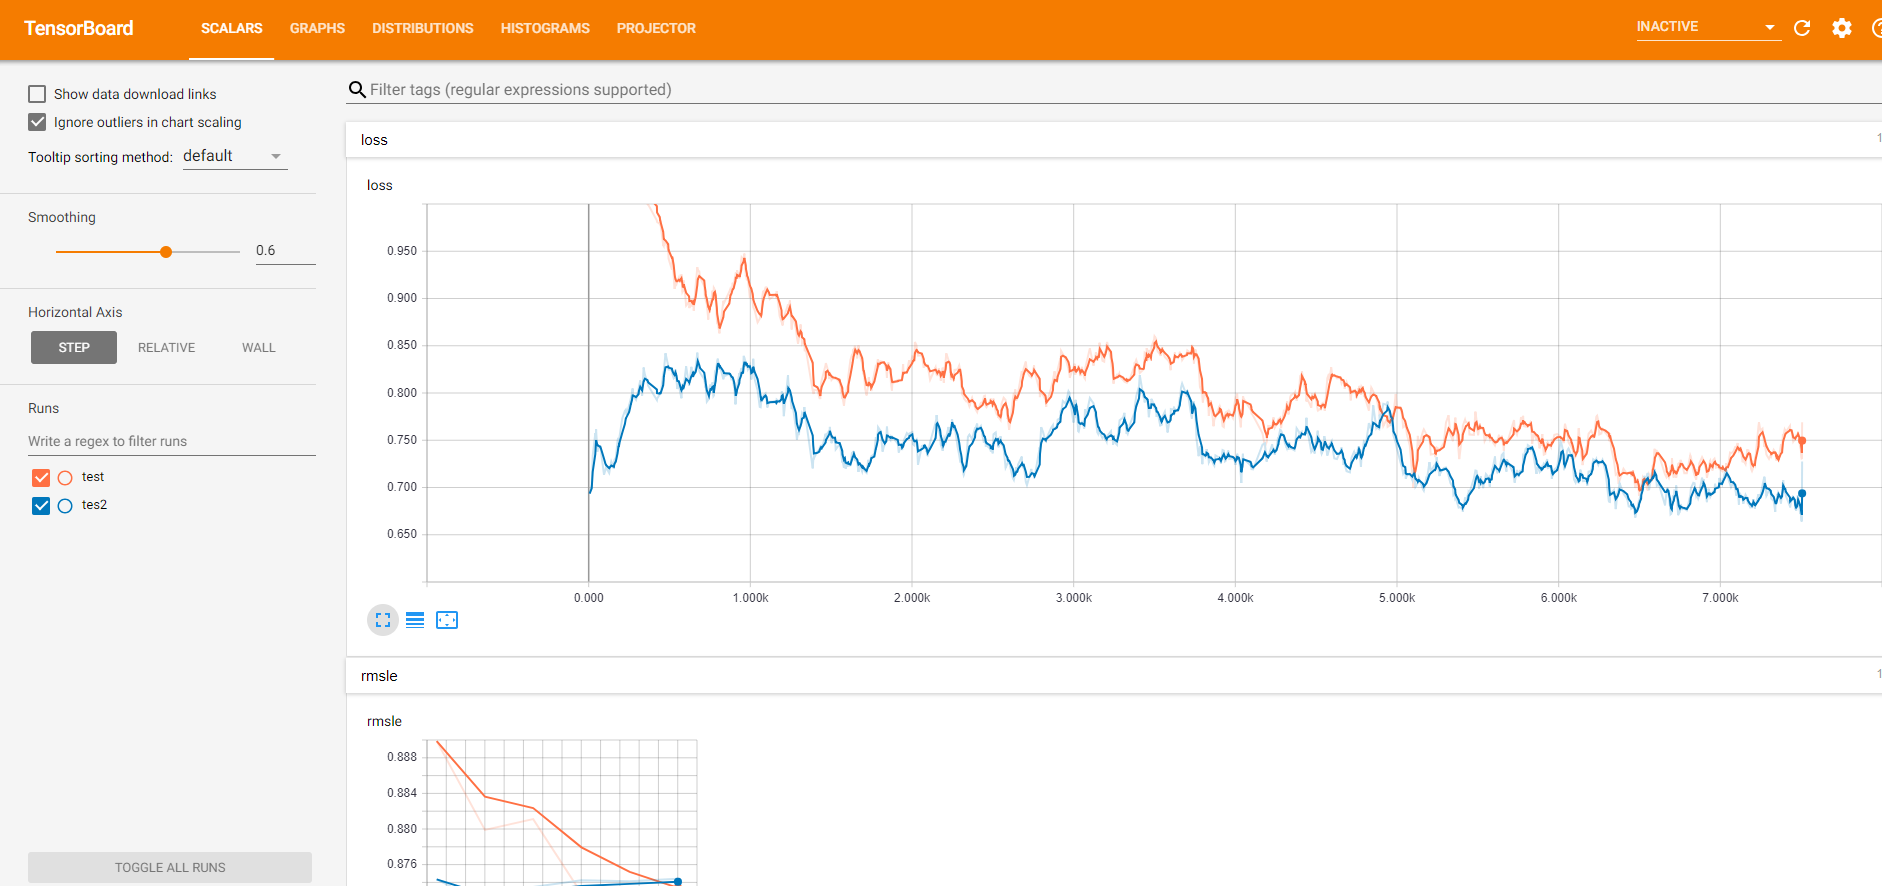
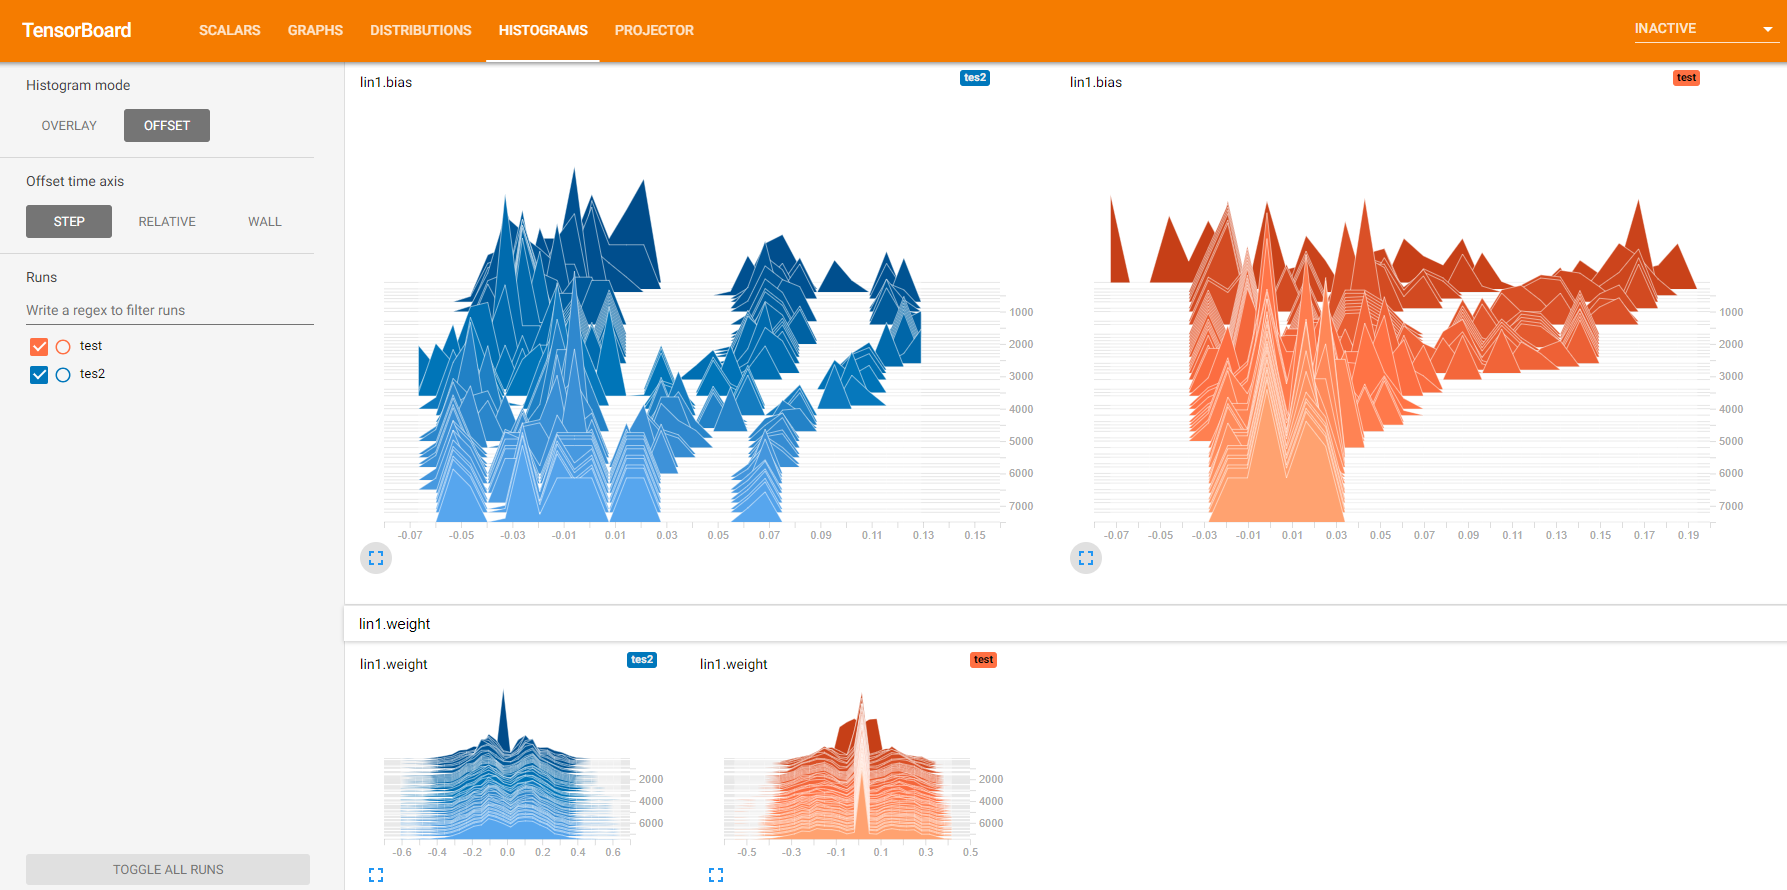
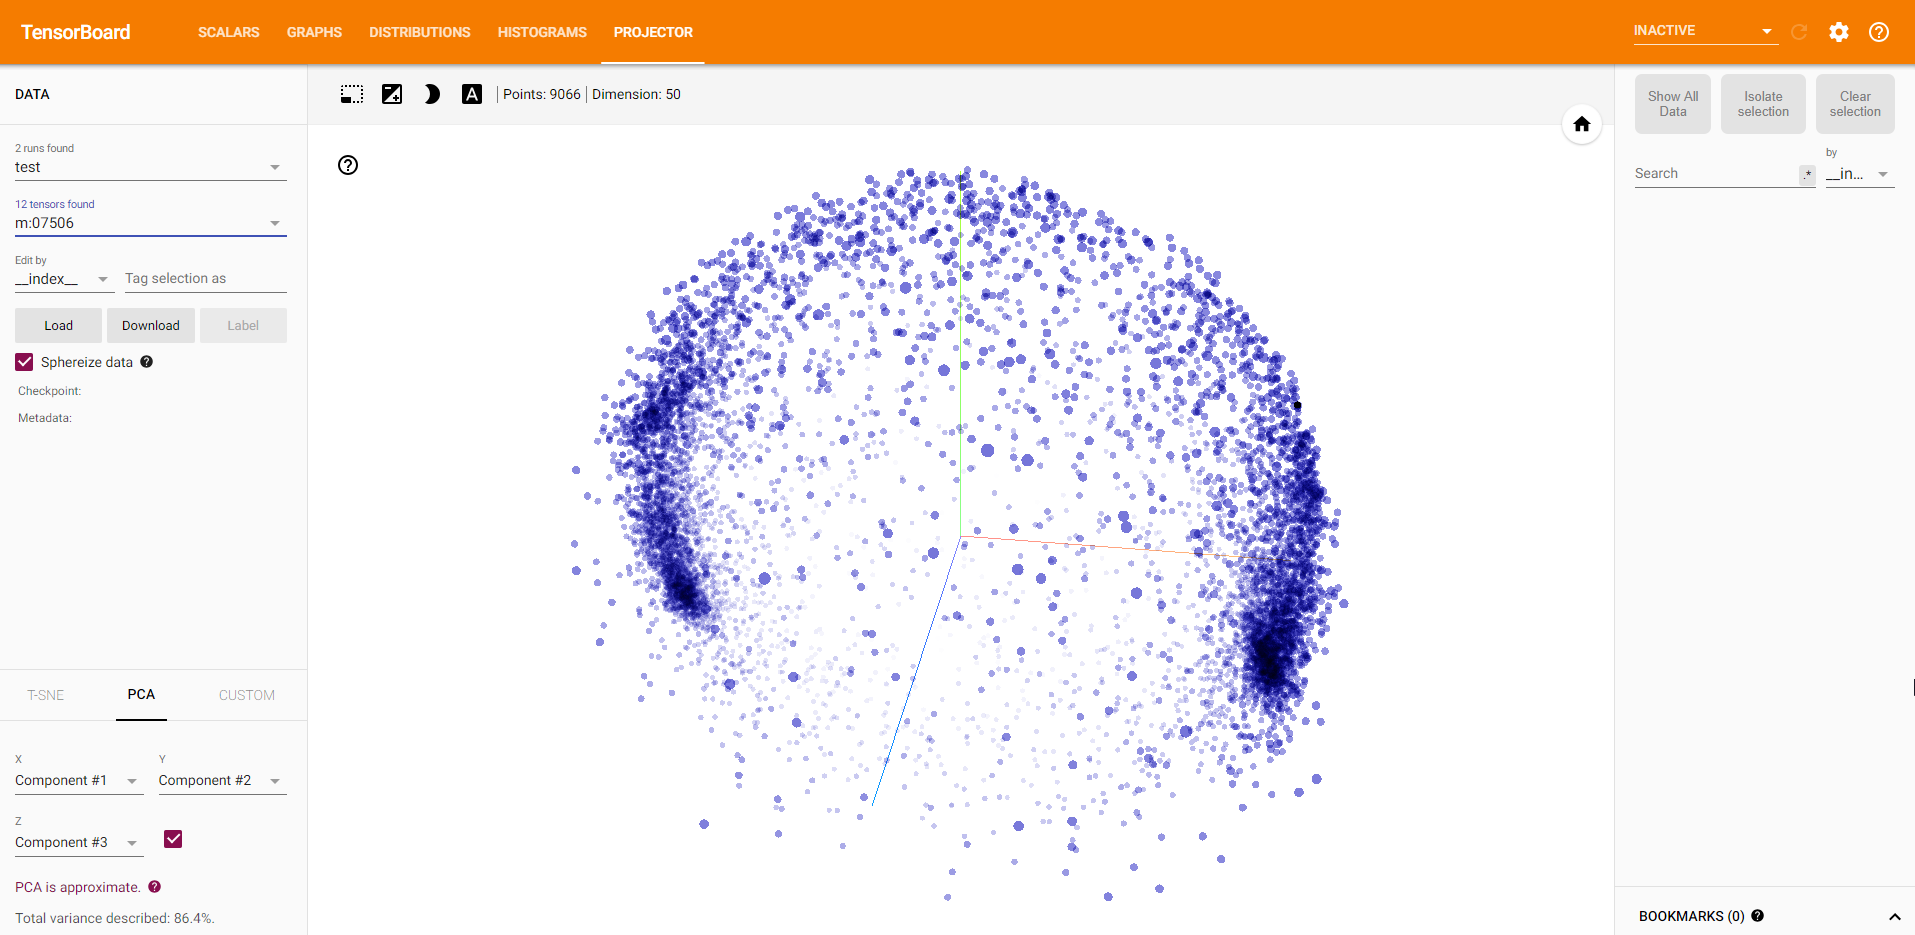
Currently this callback plots training loss, validation loss, and metrics. These plots can be viewed in Tensorboard scalars tab. More could be added in the future such as learning rate and momentum. Every X iterations a snapshot of the model’s weights are logged and can be viewed in Tensorboard histogram and distribution tab. Every epoch, the embedding layers are saved and can be viewed in 3D with dimensionality reduction, in the projector tab. Lastly, the model’s dataflow graph can be viewed in the graph tab (can be buggy with RNNs). Below are screenshots of each.
To use you must have Tensorboard and TensorboardX installed.
pip install tensorflow
pip install git+https://github.com/lanpa/tensorboard-pytorch
Graph visualization requires Pytorch >= 0.4. Fastai currently uses 0.3. I have only tested with Pytorch 0.4.
Launch the Tensorboard server with tensorboard --logdir="directory of logs file. default location is PATH/logs"
Then navigate your browser to http://localhost:6006
I made an example notebook on how to use the callback. The logs are stored at the ModelData path in the logs directory. The constructor requires a nn.Module instance, a ModelData instance, and a name for the log. The metrics_names parameter is a list of names for the fit function’s metrics. If this callback ever gets merged into fastai then these parameters (except for log name) wouldn’t be required. Modify the save path, and histogram save frequency with the path=None, histogram_freq=100 parameters.