TL;DR: How to get the model to predict price into the future after training? I suspect it’s a simple feature built in somewhere but I missed it.
I’ve modified this lesson3-rossman notebook with my own data on corn prices.
I got all sorts of my own variables in. Weather, Oil prices, corn production, etc.
Everything worked out for me.
I was able to spit 40 years of data into a ‘joined’ of 39 years and ‘joined_test’ of 1 year, and compared the prediction chart of one year to what the price actually did in that year.
What I’ve never understood is how to get a price projection into the future. If it’s only “predicting” what happened in the past then it’s not technically doing any predicting.
I TRIED making the validation set of DATES IN THE FUTURE that contain just the estimated yearly corn production numbers and the a columns of zeros for the corn price (as it always would be in the validation set). This is where I’m at a loss. What do I put in every other columns? If I start putting my guesses for what oil would be on a future date then we’re in a garbage in, garbage out situation, right?
I’m not sure how to show the model what are reliable, price dependant prediction for the future, like crop production, but don’t know how to show the model only this.
This is essentially the challenge or any time-series problem. Extrapolating beyond the given dataset comes with it’s challenges, but sounds like you’ve done the right thing with your validation set
Pretty much. It’s best to have variables that you have a decent value for, otherwise you’re better off making a model that only uses the variable that you have.
I didn’t think about this being a problem until I got to this juncture.
The traders who aren’t cheating must model multiple scenarios. Oil high, oil low, flat, USD high, low.
Hmmm. Though you can make auto conditional sells based on another security it could explode into way too many possibilities.
The biggest factor is still who buys and sells. Hard.
Question you might have the answer to.
What do I pass to the model for ‘cat_flds=’ when none of my variables are categorical?
What if they’re all continuous?
I’ve tried putting ‘None’ and ‘False’ in here, and just trying to leave ‘cat_flds’ off.
It’s sort of a bug… Use this instead, and pass an empty DataFrame in: ColumnarDataset.from_data_frames(df, pd.DataFrame())
I might look if it’s worth putting a PR in for or not
I’ve been focused on modifying the lesson3-rossman notebook.
TL;DR - Does it matter what order columns are in and what they’re named?
Maybe you can answer another question, (most of my posts go unanswered in here so I’ll just keep asking you things till you want to ignore them).
QUESTION: With column data such as in the rossman notebook, does the model know the names of the columns? Does it make use of the fact one column is next to another? I’m curious how the model puts the columns in context. Could you just put the columns in any order and it will find the correct relations?
I’m modifying the rossman notebook to look at atoms of elements in compounds and each atom has an X, Y, Z, number. I’ll try to make it so the model isn’t looking for a time sequence.
Anyways, That’s 80 atoms and each X, Y, and Z is in its own cell with Atom_1_X, Atom_2_X, etc.
I don’t remember seeing anything like this in the course.
It isn’t a change, it’s just using a different method. It’s really useful to look at the source code of the library, particularly if you’re not sure how something is working (it’s all here)
It makes no difference whatever order you put them in, so it won’t matter. The neural network learns the relationships between columns
80 atoms and each X, Y, and Z is in its own cell with Atom_1_X, Atom_2_X, etc.
Thanks for responses.
Very interesting that I can do chemical engineering by chucking it all into the model in random column order. What an age we live in.
More questions, and like I said, feel free to opt out of the questioning whenever…
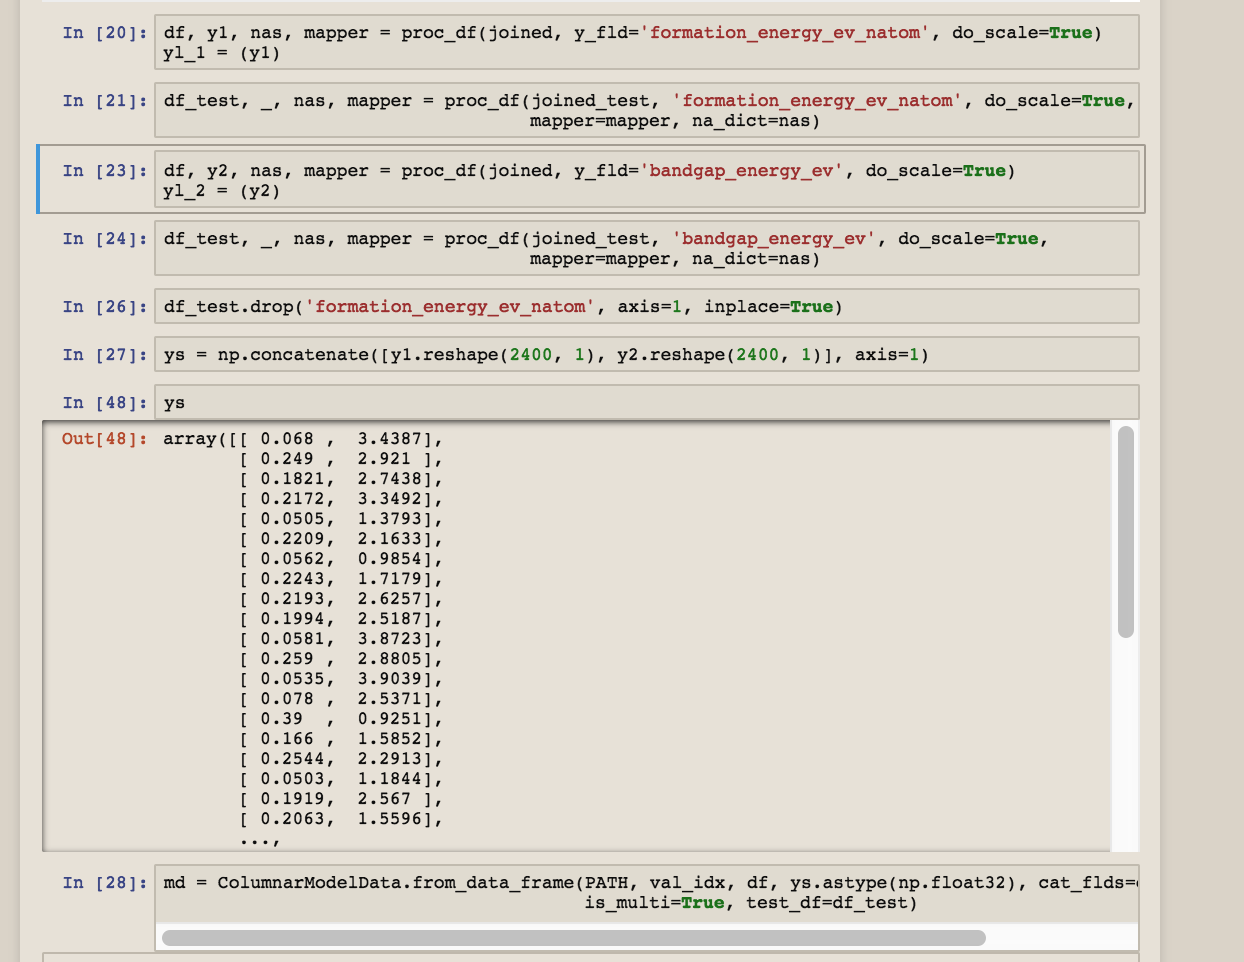
After much gnashing of teeth I got what looks like some good predictions (that I haven’t submitted yet) for this Kaggle competition https://www.kaggle.com/c/nomad2018-predict-transparent-conductors/overview
(The predictions look like random numbers in a good range but the exp_rmspe seemed pretty stuck on 1.67 for some reason despite lots of training. I’ll keep tinkering.)
QUESTION 1: It requires two different fields be predicted. Can a model predict values for two different columns? I don’t know that I’ve ever seen a model do that. Two separate Y hats, I think it’s called?
QUESTION 2: I modified the course 1 lesson3 rossman notebook to train on this data but I’m not sure if the md = ColumnarModelData.from_data_frame() loader is an RNN or something else in this notebook made it an RNN. I ask because the transparent-conductors have nothing to do with any time sequence. I looked around for docs on ColumnarModelData.from_data_frame and can’t tell if I tell it it is or is not looking at time series data or if it NEEDS TO KNOW it is looking at time series data.
I watched all the courses and don’t recall csv data in a lesson like this (not time series).
WRT Question 1. I am also trying to predict multiple values. I am interested in predicting (for example) Rossmann sales data for Day1, Day2 and Day3. Looking at the code you cannot simply have an array of [Day1, Day2 , Day3] in the “Sales” variable “df, y, nas, mapper = proc_df(joined_samp, ‘Sales’, do_scale=True)”. The fastai code seems to think that you are using category data (I think this might need a modification but not sure how yet). You will also need a metric that will take the output and compare PredictedDay1, PredictedDay2 and PredictedDay3 against actualDay1, actualDay2 and actualDay3.
You would also need to augment your day data for each store to include the extra two days.
I don’t think there is any problem theoretically with having 3 outputs (just a final array of 3) but there seems to be a couple of code issues to getting it to work. I am planning give it a go soon, if I have any luck will report back.
I was able to extrapolate your example in the notebook to my problem. It trains now. Great.
I wish there was someplace to work this out on my own but I have new issues I couldn’t find tell of on the internet or by digging into the code.
Question ONE: ‘m.fit’ has this ‘metrics’ option for a loss function (like RMSLE) but it doesn’t like two columns.
It says ‘TypeError: only 1-element tensors can be converted to Python scalars’.
Question TWO: After training for a while I try to get the model’s predictions for the two columns but I get an error.
‘pred_test=m.predict(True)’ returns…
‘RuntimeError: running_mean should contain 261 elements not 262’
and I can tell this has something to do with my continuous variables since I have 261 continuous variables.
I tried setting the ‘n_cont’ in ‘md.get_learner’ up 1 and down 1 but I get an error like this.
‘RuntimeError: running_mean should contain 262 elements not 261’
Hi there! I’m trying to figure out how to implement metrics with three arguments like NWRMSLE (see https://www.kaggle.com/c/favorita-grocery-sales-forecasting#evaluation) - the arguments include Y_predicted, Y, and Weights.
I took a look at the library’s source code but didn’t get any idea. Could someone provide a way or comment?
Figured out how to get the model to give me its predictions (an issue in my last question).
I removed the second column from ‘df’ as I also did in ‘df_test’ before.
I was able to submit to the competition and my result was within 0.014 of number one - though still in 500 something place. If I could see my error before submitting maybe I could do some fine tuning.
Still getting ‘TypeError: only 1-element tensors can be converted to Python scalars’ when trying to get RMSLE function displayed while training.
I suspect it requires a new loss function and inside knowledge of where access what the ‘metrics=’ option is using when there’s just one column.
Yeah, that’s a valid point. THe only way to have all these data such as weather conditions of any day in the future is to wait for that day to arrive. Needless to say, if sales can only be predicted on that day, it’s too late to be useful to anyone.
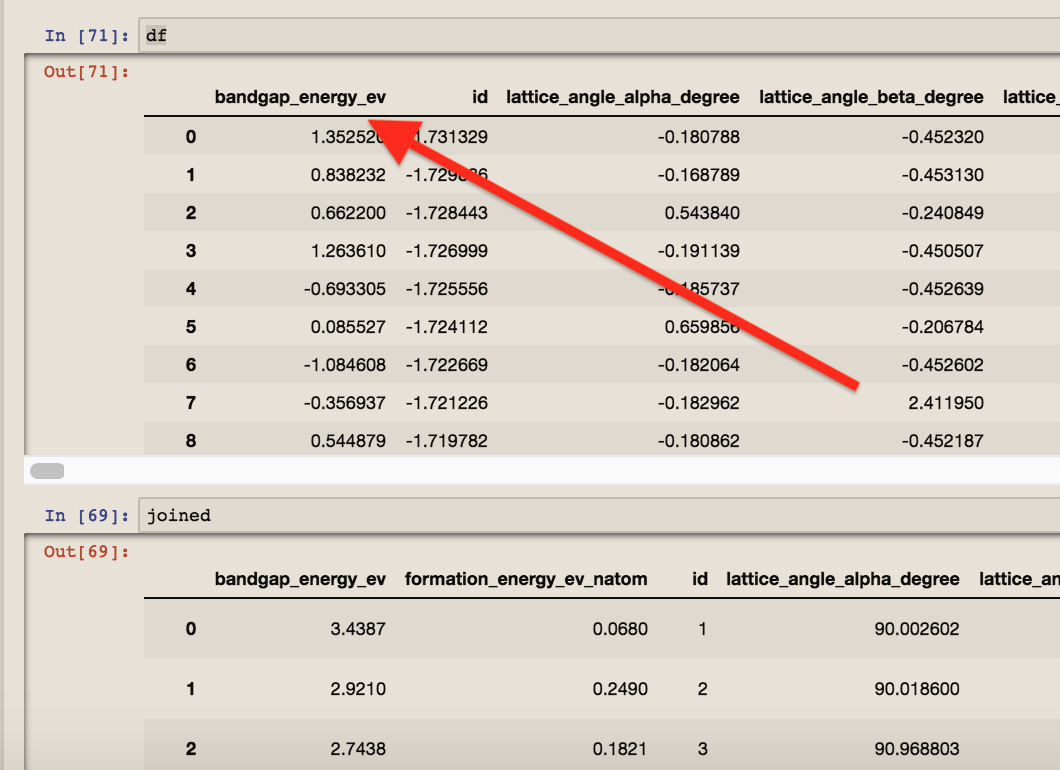
Issues with scaling/normalizing data. When training the model, the columns of the training data each must have parameters that define that column’s standardization. How do you use the parameters from the training data on the validation and test sets and how do you use them when making predictions?
It appears that the y-values are not standardized. My y-values are profits and they can be both positive and negative. Executing nl = np.log(y) fails. nl is required by ColumnarModelData.from_data_frame(). How do I get around this problem?